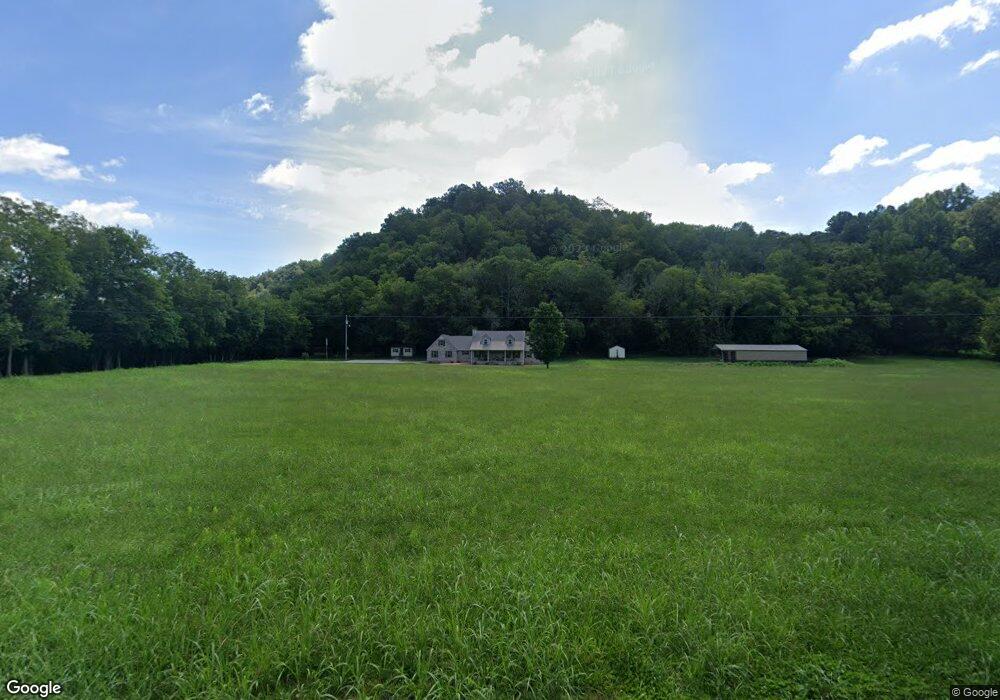
2336 Noah Rd Beechgrove, TN 37018
Estimated Value: $409,948 - $455,000
--
Bed
2
Baths
2,688
Sq Ft
$161/Sq Ft
Est. Value
About This Home
This home is located at 2336 Noah Rd, Beechgrove, TN 37018 and is currently estimated at $432,474, approximately $160 per square foot. 2336 Noah Rd is a home located in Coffee County with nearby schools including North Coffee Elementary School, Coffee County Middle School, and Coffee County Central High School.
Ownership History
Date
Name
Owned For
Owner Type
Purchase Details
Closed on
Jun 23, 2017
Sold by
Anderson Horace Lee
Bought by
Roberts Kenneth R and Anderson Kathy N
Current Estimated Value
Purchase Details
Closed on
Dec 22, 1999
Sold by
Anderson Nolan
Bought by
Roberts Kenneth and Roberts Kathy N
Purchase Details
Closed on
Jun 4, 1993
Bought by
Roberts Kenneth R and Roberts Kathy N
Create a Home Valuation Report for This Property
The Home Valuation Report is an in-depth analysis detailing your home's value as well as a comparison with similar homes in the area
Home Values in the Area
Average Home Value in this Area
Purchase History
| Date | Buyer | Sale Price | Title Company |
|---|---|---|---|
| Roberts Kenneth R | -- | None Available | |
| Roberts Kenneth | $1,000 | -- | |
| Roberts Kenneth R | $1,000 | -- |
Source: Public Records
Tax History Compared to Growth
Tax History
| Year | Tax Paid | Tax Assessment Tax Assessment Total Assessment is a certain percentage of the fair market value that is determined by local assessors to be the total taxable value of land and additions on the property. | Land | Improvement |
|---|---|---|---|---|
| 2024 | $1,585 | $68,000 | $9,750 | $58,250 |
| 2023 | $1,585 | $68,000 | $0 | $0 |
| 2022 | $1,585 | $68,000 | $9,750 | $58,250 |
| 2021 | $1,535 | $52,350 | $6,725 | $45,625 |
| 2020 | $1,535 | $52,350 | $6,725 | $45,625 |
| 2019 | $1,535 | $52,350 | $6,725 | $45,625 |
| 2018 | $1,389 | $52,350 | $6,725 | $45,625 |
| 2017 | $1,308 | $40,075 | $6,275 | $33,800 |
| 2016 | $1,308 | $40,075 | $6,275 | $33,800 |
| 2015 | $1,308 | $40,075 | $6,275 | $33,800 |
| 2014 | $1,308 | $40,073 | $0 | $0 |
Source: Public Records
Map
Nearby Homes
- 1 Noah Rd
- 0 Oneal Hollow Ln
- 723 Heritage Hill Ln
- 426 Fern Gully Ln
- 7227 Fredonia Rd
- 382 Shelley Rd
- 250 Shelley Rd
- 1959 French Brantley Rd
- 3786 Gnat Hill Rd
- 559 Geneva Boynton Rd
- 0 Paul Harrell Rd
- 97 Lloyd Boynton Rd
- 0 Panhandle Rd
- 0 Lakewood Park Rd
- 2960 Gnat Hill Rd
- 456 Lakewood Park Rd
- 230 Bankshire Rd
- 7111 Murfreesboro Hwy
- 6985 Murfreesboro Hwy Unit 6985
- 79 Sharps Ln
- 0 Noah Rd
- 2430 Noah Rd
- 64 Oneal Hollow Ln
- 176 Ferrells Branch Rd
- 162 Carter Farms Rd
- 247 Ferrells Branch Rd
- 1905 Noah Rd
- 2842 Noah Rd
- 2927 Noah Rd
- 1806 Noah Rd
- 2963 Noah Rd
- 590 Ferrells Branch Rd
- 670 Oneal Hollow Ln
- 1535 Noah Rd
- 1466 Noah Rd
- 3281 Noah Rd
- 341 Carden Hollow Ln
- 3341 Noah Rd
- 920 Ferrells Branch Rd