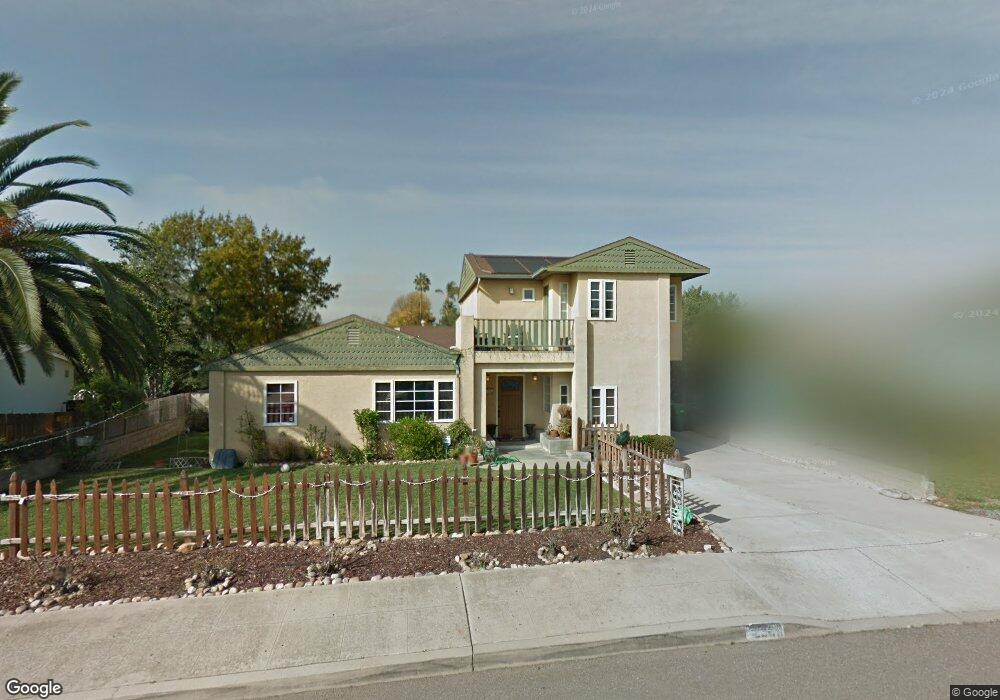
2338 Charles Way El Cajon, CA 92020
Fletcher Hills NeighborhoodEstimated Value: $1,034,000 - $1,222,000
4
Beds
2
Baths
2,366
Sq Ft
$477/Sq Ft
Est. Value
About This Home
This home is located at 2338 Charles Way, El Cajon, CA 92020 and is currently estimated at $1,127,484, approximately $476 per square foot. 2338 Charles Way is a home located in San Diego County with nearby schools including Northmont Elementary School, Parkway Academy, and West Hills High School.
Ownership History
Date
Name
Owned For
Owner Type
Purchase Details
Closed on
Sep 9, 2020
Sold by
Degraff Craig Allen
Bought by
Craig A Degraff Revocable Trust and Degraff
Current Estimated Value
Home Financials for this Owner
Home Financials are based on the most recent Mortgage that was taken out on this home.
Original Mortgage
$520,500
Interest Rate
2.7%
Mortgage Type
New Conventional
Purchase Details
Closed on
Aug 27, 2012
Sold by
Degraff Craig Allen
Bought by
Degraff Craig Allen
Home Financials for this Owner
Home Financials are based on the most recent Mortgage that was taken out on this home.
Original Mortgage
$409,000
Interest Rate
3.49%
Mortgage Type
New Conventional
Purchase Details
Closed on
Jun 24, 2012
Sold by
Degraff Craig
Bought by
Degraff Craig Allen
Purchase Details
Closed on
Jun 23, 2012
Sold by
Degraff Craig and Degraff Annette
Bought by
Degraff Craig
Purchase Details
Closed on
Jan 10, 2008
Sold by
Degraff Craig and Degraff Annie
Bought by
Degraff Craig Allen and Degraff Annette Fay
Purchase Details
Closed on
Oct 15, 2004
Sold by
Gower Allen G
Bought by
Degraff Craig and Degraff Annie
Home Financials for this Owner
Home Financials are based on the most recent Mortgage that was taken out on this home.
Original Mortgage
$456,000
Interest Rate
5.75%
Mortgage Type
Purchase Money Mortgage
Purchase Details
Closed on
Jan 28, 2003
Sold by
Gower Laura K
Bought by
Gower Allen G
Home Financials for this Owner
Home Financials are based on the most recent Mortgage that was taken out on this home.
Original Mortgage
$300,000
Interest Rate
5.83%
Purchase Details
Closed on
Jun 12, 2002
Sold by
Price Harry J and Stephenson Roberta A
Bought by
Gower Allen G and Gower Laura K
Home Financials for this Owner
Home Financials are based on the most recent Mortgage that was taken out on this home.
Original Mortgage
$280,000
Interest Rate
6.74%
Purchase Details
Closed on
Oct 26, 1998
Sold by
Price Harry J
Bought by
Price Harry J and Stephenson Roberta A
Home Financials for this Owner
Home Financials are based on the most recent Mortgage that was taken out on this home.
Original Mortgage
$139,000
Interest Rate
6.52%
Purchase Details
Closed on
Jan 17, 1995
Sold by
Stephenson Roberta Ann
Bought by
Price Harry J
Home Financials for this Owner
Home Financials are based on the most recent Mortgage that was taken out on this home.
Original Mortgage
$140,000
Interest Rate
9.29%
Create a Home Valuation Report for This Property
The Home Valuation Report is an in-depth analysis detailing your home's value as well as a comparison with similar homes in the area
Home Values in the Area
Average Home Value in this Area
Purchase History
| Date | Buyer | Sale Price | Title Company |
|---|---|---|---|
| Craig A Degraff Revocable Trust | -- | None Listed On Document | |
| Degraff Craig Allen | -- | None Listed On Document | |
| Degraff Craig Allen | -- | Accommodation | |
| Degraff Craig Allen | -- | Accommodation | |
| Degraff Craig Allen | -- | None Available | |
| Degraff Craig | -- | None Available | |
| Degraff Craig | -- | None Available | |
| Degraff Craig Allen | -- | None Available | |
| Degraff Craig | $570,000 | Alliance Title Company | |
| Gower Allen G | -- | Fidelity National Title Co | |
| Gower Allen G | $400,000 | Commonwealth Land Title Co | |
| Price Harry J | -- | First American Title | |
| Price Harry J | -- | First American Title Co |
Source: Public Records
Mortgage History
| Date | Status | Borrower | Loan Amount |
|---|---|---|---|
| Previous Owner | Degraff Craig Allen | $520,500 | |
| Previous Owner | Degraff Craig Allen | $409,000 | |
| Previous Owner | Degraff Craig | $456,000 | |
| Previous Owner | Gower Allen G | $300,000 | |
| Previous Owner | Gower Allen G | $280,000 | |
| Previous Owner | Price Harry J | $139,000 | |
| Previous Owner | Price Harry J | $140,000 | |
| Closed | Degraff Craig | $34,000 |
Source: Public Records
Tax History Compared to Growth
Tax History
| Year | Tax Paid | Tax Assessment Tax Assessment Total Assessment is a certain percentage of the fair market value that is determined by local assessors to be the total taxable value of land and additions on the property. | Land | Improvement |
|---|---|---|---|---|
| 2025 | $10,827 | $863,784 | $299,682 | $564,102 |
| 2024 | $10,827 | $846,848 | $293,806 | $553,042 |
| 2023 | $10,055 | $830,245 | $288,046 | $542,199 |
| 2022 | $11,015 | $813,967 | $282,399 | $531,568 |
| 2021 | $9,182 | $700,000 | $239,000 | $461,000 |
| 2020 | $8,410 | $670,000 | $229,000 | $441,000 |
| 2019 | $7,253 | $630,000 | $216,000 | $414,000 |
| 2018 | $7,070 | $615,000 | $216,000 | $399,000 |
| 2017 | $6,236 | $540,000 | $190,000 | $350,000 |
| 2016 | $5,924 | $520,000 | $183,000 | $337,000 |
| 2015 | $5,683 | $495,000 | $175,000 | $320,000 |
| 2014 | $5,390 | $470,000 | $167,000 | $303,000 |
Source: Public Records
Map
Nearby Homes
- 2394 Dryden Rd
- 282 Garfield Ave
- 2213 Chatham St
- 198 Croydon Ln
- 9348 Horton Dr
- 1681 Hillsmont Dr
- 6130 Howell Dr
- 1673 Hillsmont Dr
- 700 Wakefield Ct
- 275 Hihill Way
- 1958 Milford Place
- 188 Garden Grove Ln
- 5750 Amaya Dr Unit 10
- 5654 Amaya Dr Unit 150
- 5931 Howell Dr Unit 14
- 2524 Seattle Dr
- 302 Travelodge Dr
- 316 Travelodge Dr
- 370 N Cuyamaca St
- 8767 Blue Lake Dr
- 2342 Charles Way
- 2324 Charles Way
- 2316 Charles Way
- 2366 Charles Way
- 2335 Charles Way
- 2351 Charles Way
- 2327 Charles Way
- 2302 Charles Way
- 2384 Charles Way
- 2373 Charles Way
- 2319 Charles Way
- 2333 Louise Ct
- 2232 Virginia Ct
- 2357 Louise Ct
- 2411 Charles Way
- 2307 Charles Way
- 2416 Charles Way
- 2297 Charles Way
- 2338 Louise Ct
- 2375 Louise Ct