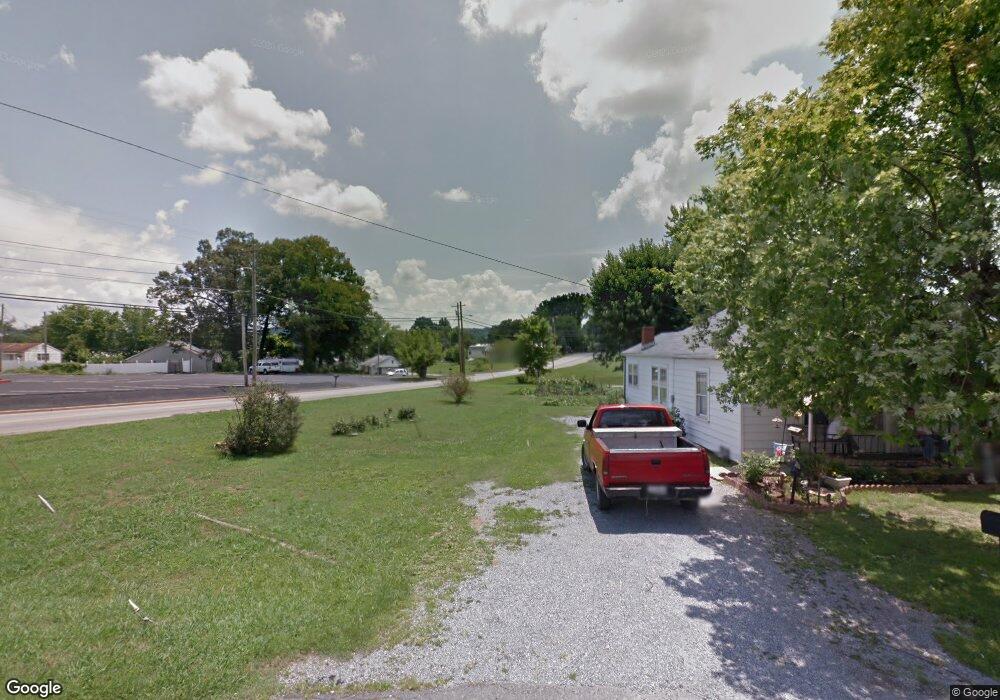
2338 E Side Ave Johnson City, TN 37601
Estimated Value: $169,000 - $195,000
--
Bed
1
Bath
864
Sq Ft
$212/Sq Ft
Est. Value
About This Home
This home is located at 2338 E Side Ave, Johnson City, TN 37601 and is currently estimated at $182,840, approximately $211 per square foot. 2338 E Side Ave is a home located in Washington County with nearby schools including Fairmont Elementary School, Liberty Bell Middle School, and Indian Trail Middle School.
Ownership History
Date
Name
Owned For
Owner Type
Purchase Details
Closed on
Mar 30, 2023
Sold by
Buchanan Jacob
Bought by
Buchanan John
Current Estimated Value
Purchase Details
Closed on
May 3, 2018
Sold by
Buchanan John
Bought by
Buchanan Jacob
Purchase Details
Closed on
Mar 5, 2018
Sold by
Buchanan Jacob
Bought by
Buchanan John
Purchase Details
Closed on
May 31, 2017
Sold by
Buchanan John
Bought by
Buchanan Jacob
Purchase Details
Closed on
Nov 19, 2014
Sold by
Buchanan John
Bought by
Buchanan Jacob
Purchase Details
Closed on
Mar 18, 2014
Sold by
Buchanan Deborah
Bought by
Buchanan John
Purchase Details
Closed on
Nov 4, 2009
Sold by
Forbes Roy L
Bought by
Buchanan Deborah
Purchase Details
Closed on
Mar 26, 2004
Sold by
Haynes Donna K
Bought by
Forbes Roy L
Purchase Details
Closed on
Mar 20, 2004
Sold by
Driscoll Paul R and Driscoll Anna L
Bought by
Forbes Roy L
Purchase Details
Closed on
Dec 6, 2000
Sold by
Paul Driscoll
Bought by
Haynes Donna K
Create a Home Valuation Report for This Property
The Home Valuation Report is an in-depth analysis detailing your home's value as well as a comparison with similar homes in the area
Home Values in the Area
Average Home Value in this Area
Purchase History
| Date | Buyer | Sale Price | Title Company |
|---|---|---|---|
| Buchanan John | -- | None Listed On Document | |
| Buchanan John | -- | None Listed On Document | |
| Buchanan Jacob | $50,000 | None Available | |
| Buchanan John | -- | None Available | |
| Buchanan Jacob | -- | None Available | |
| Buchanan Jacob | -- | -- | |
| Buchanan John | -- | -- | |
| Buchanan Deborah | $50,000 | -- | |
| Forbes Roy L | $52,500 | -- | |
| Forbes Roy L | $52,500 | -- | |
| Haynes Donna K | -- | -- |
Source: Public Records
Tax History Compared to Growth
Tax History
| Year | Tax Paid | Tax Assessment Tax Assessment Total Assessment is a certain percentage of the fair market value that is determined by local assessors to be the total taxable value of land and additions on the property. | Land | Improvement |
|---|---|---|---|---|
| 2024 | $885 | $51,725 | $11,275 | $40,450 |
| 2022 | $549 | $25,550 | $5,975 | $19,575 |
| 2021 | $991 | $25,550 | $5,975 | $19,575 |
| 2020 | $986 | $25,550 | $5,975 | $19,575 |
| 2019 | $295 | $25,550 | $5,975 | $19,575 |
| 2018 | $529 | $12,400 | $3,975 | $8,425 |
| 2017 | $529 | $12,400 | $3,975 | $8,425 |
| 2016 | $527 | $12,400 | $3,975 | $8,425 |
| 2015 | $477 | $12,400 | $3,975 | $8,425 |
| 2014 | $446 | $12,400 | $3,975 | $8,425 |
Source: Public Records
Map
Nearby Homes
- 807 Long St
- 1213 Glynridge St
- 1217 Glynridge Ave
- 2239 E Fairview Ave
- 904 Mcarthur St
- 2102 E Unaka Ave
- 1324 E Lakeview Dr
- 2615 Louise St
- 2107 E Watauga Ave
- 2112 E Watauga Ave
- 1620 Fairway Dr
- 1605 Woodmont Dr
- 1810 E Watauga Ave
- 604 Duke St
- 1605 E Unaka Ave
- 1607 E Watauga Ave
- 1605 E Myrtle Ave
- 1700 E Millard St
- 1314 Woodland Ave
- 1607 E Millard St
- 2334 E Side Ave
- 1101 E Lakeview Dr
- 2332 E Side Ave
- 2333 E Side Ave
- 2330 E Side Ave
- 904 Bernie St
- 1111 E Lakeview Dr
- 1111 E Lakeview Dr
- 2328 E Side Ave
- 2305 Sarah St
- 2301 Sarah St
- 1204 Meadowview Ave
- 908 E Lakeview Dr
- 2326 E Side Ave
- 2309 Sarah St
- 1110 E Lakeview Dr
- 1201 Meadowview Ave
- 1201 Meadowview Ave Unit 1
- 2324 E Side Ave
- 1208 Meadowview Ave