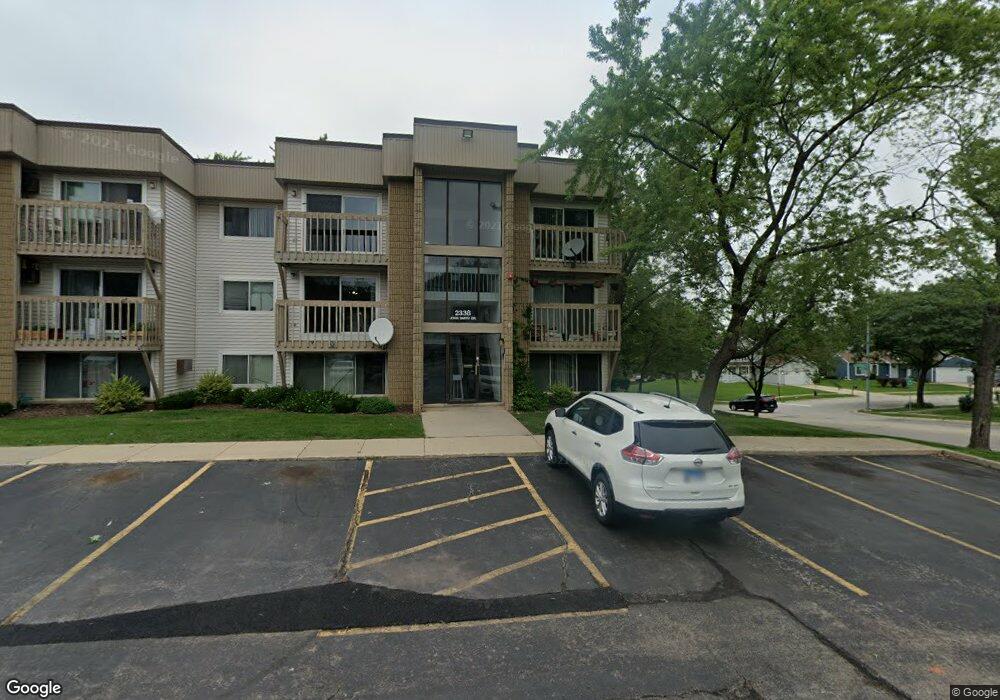
2338 John Smith Dr Unit 2338A Schaumburg, IL 60194
West Schaumburg NeighborhoodEstimated Value: $137,000 - $207,000
2
Beds
--
Bath
850
Sq Ft
$190/Sq Ft
Est. Value
About This Home
This home is located at 2338 John Smith Dr Unit 2338A, Schaumburg, IL 60194 and is currently estimated at $161,396, approximately $189 per square foot. 2338 John Smith Dr Unit 2338A is a home located in Cook County with nearby schools including Elizabeth Blackwell Elementary School, Dwight D Eisenhower Junior High School, and Hoffman Estates High School.
Ownership History
Date
Name
Owned For
Owner Type
Purchase Details
Closed on
Jul 20, 2017
Sold by
Parekh Pranav and Parekh Ami P
Bought by
Soryana Capital Llc Series 1
Current Estimated Value
Purchase Details
Closed on
Jan 21, 2010
Sold by
Chicago Title Land Trust Company
Bought by
Parekh Pranav and Parekh Ami P
Home Financials for this Owner
Home Financials are based on the most recent Mortgage that was taken out on this home.
Original Mortgage
$297,500
Interest Rate
5.75%
Mortgage Type
Unknown
Purchase Details
Closed on
Jun 23, 1995
Sold by
American National Bk & Tr Co Of Chicago
Bought by
Chicago Title & Trust Company
Home Financials for this Owner
Home Financials are based on the most recent Mortgage that was taken out on this home.
Original Mortgage
$241,111
Interest Rate
7.9%
Create a Home Valuation Report for This Property
The Home Valuation Report is an in-depth analysis detailing your home's value as well as a comparison with similar homes in the area
Home Values in the Area
Average Home Value in this Area
Purchase History
| Date | Buyer | Sale Price | Title Company |
|---|---|---|---|
| Soryana Capital Llc Series 1 | -- | None Available | |
| Parekh Pranav | $425,000 | Fatic | |
| Chicago Title & Trust Company | $270,000 | -- |
Source: Public Records
Mortgage History
| Date | Status | Borrower | Loan Amount |
|---|---|---|---|
| Previous Owner | Parekh Pranav | $297,500 | |
| Previous Owner | Chicago Title & Trust Company | $241,111 |
Source: Public Records
Tax History Compared to Growth
Tax History
| Year | Tax Paid | Tax Assessment Tax Assessment Total Assessment is a certain percentage of the fair market value that is determined by local assessors to be the total taxable value of land and additions on the property. | Land | Improvement |
|---|---|---|---|---|
| 2024 | $2,748 | $9,803 | $2,965 | $6,838 |
| 2023 | $2,665 | $9,803 | $2,965 | $6,838 |
| 2022 | $2,665 | $9,803 | $2,965 | $6,838 |
| 2021 | $2,418 | $7,923 | $2,028 | $5,895 |
| 2020 | $2,388 | $7,923 | $2,028 | $5,895 |
| 2019 | $2,404 | $8,850 | $2,028 | $6,822 |
| 2018 | $2,303 | $7,558 | $1,638 | $5,920 |
| 2017 | $2,260 | $7,558 | $1,638 | $5,920 |
| 2016 | $2,320 | $8,287 | $1,638 | $6,649 |
| 2015 | $1,620 | $5,339 | $1,482 | $3,857 |
| 2014 | $1,602 | $5,339 | $1,482 | $3,857 |
| 2013 | $1,562 | $5,339 | $1,482 | $3,857 |
Source: Public Records
Map
Nearby Homes
- 2216 Andover Ct
- 2312 Hyde Ct
- 8 Warwick Ct
- 10 Warwick Ct
- 2201 Brittany Ct Unit 20
- 1924 Quaker Hollow Ln Unit 14
- 155 Hastings Mill Rd
- 741 N Walnut Ln
- 1968 Quaker Hollow Ln Unit 12
- 1929 Hastings Ct Unit 3
- 569 N Walnut Ln
- 1912 Finchley Ct Unit 3
- 808 Bishop Ct Unit 2
- 508 N Walnut Ln
- 208 Judy Ln
- 454 Willington Dr
- 413 Linsey Ave
- 1103 Southbridge Ln
- 604 N Brookdale Dr
- 1121 Southbridge Ln
- 2338 John Smith Dr Unit 2338F
- 2338 John Smith Dr Unit 2338E
- 2338 John Smith Dr Unit 2338D
- 2338 John Smith Dr Unit 2338C
- 2338 John Smith Dr Unit 2338B
- 2338 John Smith Dr Unit B
- 2338 John Smith Dr Unit E
- 2350 John Smith Dr Unit A
- 2350 John Smith Dr Unit 2350B
- 2350 John Smith Dr Unit 2350A
- 2350 John Smith Dr Unit 2350C
- 2350 John Smith Dr Unit 2350F
- 2350 John Smith Dr Unit 2350E
- 2350 John Smith Dr Unit 2350D
- 2350 John Smith Dr Unit C
- 2350 John Smith Dr Unit F
- 2350 John Smith Dr Unit B
- 2350 John Smith Dr Unit D
- 2350 John Smith Dr Unit E
- 2344 John Smith Dr Unit 2344A