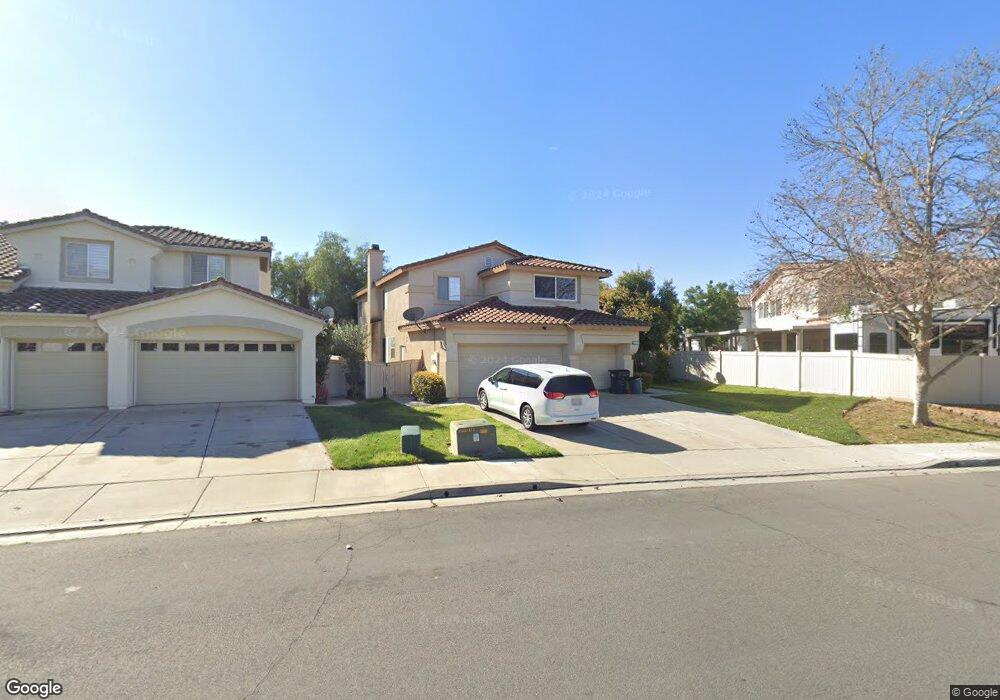
23389 Mountain Song Loop Murrieta, CA 92562
Estimated Value: $730,524 - $945,000
5
Beds
3
Baths
2,855
Sq Ft
$282/Sq Ft
Est. Value
About This Home
This home is located at 23389 Mountain Song Loop, Murrieta, CA 92562 and is currently estimated at $805,381, approximately $282 per square foot. 23389 Mountain Song Loop is a home located in Riverside County with nearby schools including Cole Canyon Elementary School, Thompson Middle School, and Murrieta Valley High School.
Ownership History
Date
Name
Owned For
Owner Type
Purchase Details
Closed on
Nov 19, 2013
Sold by
The California Lp
Bought by
2013 1 Ih Borrower Lp
Current Estimated Value
Home Financials for this Owner
Home Financials are based on the most recent Mortgage that was taken out on this home.
Original Mortgage
$479,137,000
Outstanding Balance
$354,605,463
Interest Rate
4.04%
Mortgage Type
Purchase Money Mortgage
Estimated Equity
-$353,800,082
Purchase Details
Closed on
May 9, 2012
Sold by
Davis & Davis Enterprises Llc
Bought by
Thr California Llc
Purchase Details
Closed on
Jun 20, 2006
Sold by
Davis Peter E and Davis Kris R
Bought by
Davis & Davis Enterprises Llc
Purchase Details
Closed on
Oct 13, 2000
Sold by
Continental Residential Inc
Bought by
Davis Peter E and Davis Kris R
Home Financials for this Owner
Home Financials are based on the most recent Mortgage that was taken out on this home.
Original Mortgage
$252,137
Interest Rate
7.89%
Mortgage Type
Stand Alone First
Create a Home Valuation Report for This Property
The Home Valuation Report is an in-depth analysis detailing your home's value as well as a comparison with similar homes in the area
Purchase History
| Date | Buyer | Sale Price | Title Company |
|---|---|---|---|
| 2013 1 Ih Borrower Lp | -- | None Available | |
| Thr California Llc | $251,400 | Fidelity National Title Co | |
| Davis & Davis Enterprises Llc | -- | None Available | |
| Davis Peter E | $252,500 | Fidelity National Title Co |
Source: Public Records
Mortgage History
| Date | Status | Borrower | Loan Amount |
|---|---|---|---|
| Open | 2013 1 Ih Borrower Lp | $479,137,000 | |
| Previous Owner | Davis Peter E | $252,137 |
Source: Public Records
Tax History
| Year | Tax Paid | Tax Assessment Tax Assessment Total Assessment is a certain percentage of the fair market value that is determined by local assessors to be the total taxable value of land and additions on the property. | Land | Improvement |
|---|---|---|---|---|
| 2025 | $7,321 | $493,243 | $116,056 | $377,187 |
| 2023 | $7,321 | $474,092 | $111,550 | $362,542 |
| 2022 | $7,445 | $464,797 | $109,363 | $355,434 |
| 2021 | $7,491 | $455,684 | $107,219 | $348,465 |
| 2020 | $7,421 | $451,012 | $106,120 | $344,892 |
| 2019 | $7,312 | $442,170 | $104,040 | $338,130 |
| 2018 | $7,246 | $433,500 | $102,000 | $331,500 |
| 2017 | $5,618 | $297,616 | $75,756 | $221,860 |
| 2016 | $5,489 | $291,781 | $74,271 | $217,510 |
| 2015 | $5,615 | $287,400 | $73,156 | $214,244 |
| 2014 | $5,405 | $350,000 | $100,000 | $250,000 |
Source: Public Records
Map
Nearby Homes
- 23377 Mountain Song Loop
- 23401 Rouge River Ln
- 23360 Mountain Song Loop
- 23556 Kathryn St
- 23427 Mountain Song Loop
- 41897 Black Mountain Trail
- 23457 Mountain Breeze Dr
- 41679 Grand View Dr
- 23809 Barberry Place
- 23832 Barberry Place
- 23490 Karen Place
- 23571 Evening Primrose Ct
- 23427 Fern Place
- 23483 Karen Place
- 41871 Dahlias Way
- 23717 Ballestros Rd
- 23842 Jonathan Place
- 23831 Cloverleaf Way
- 42376 Wildwood Ln
- 23311 Copa de Oro Ct
- 23385 Mountain Song Loop
- 41996 Yukon Ct
- 41992 Yukon Ct
- 23381 Mountain Song Loop
- 23384 Mountain Song Loop
- 23388 Mountain Song Loop
- 42000 Yukon Ct
- 23380 Mountain Song Loop
- 23373 Mountain Song Loop
- 23392 Mountain Song Loop
- 42001 Yukon Ct
- 23376 Mountain Song Loop
- 41997 Yukon Ct
- 23396 Mountain Song Loop
- 23369 Mountain Song Loop
- 41993 Yukon Ct
- 23400 Rouge River Ln
- 23372 Mountain Song Loop
- 23400 Mountain Song Loop
- 23405 Rouge River Ln
Your Personal Tour Guide
Ask me questions while you tour the home.