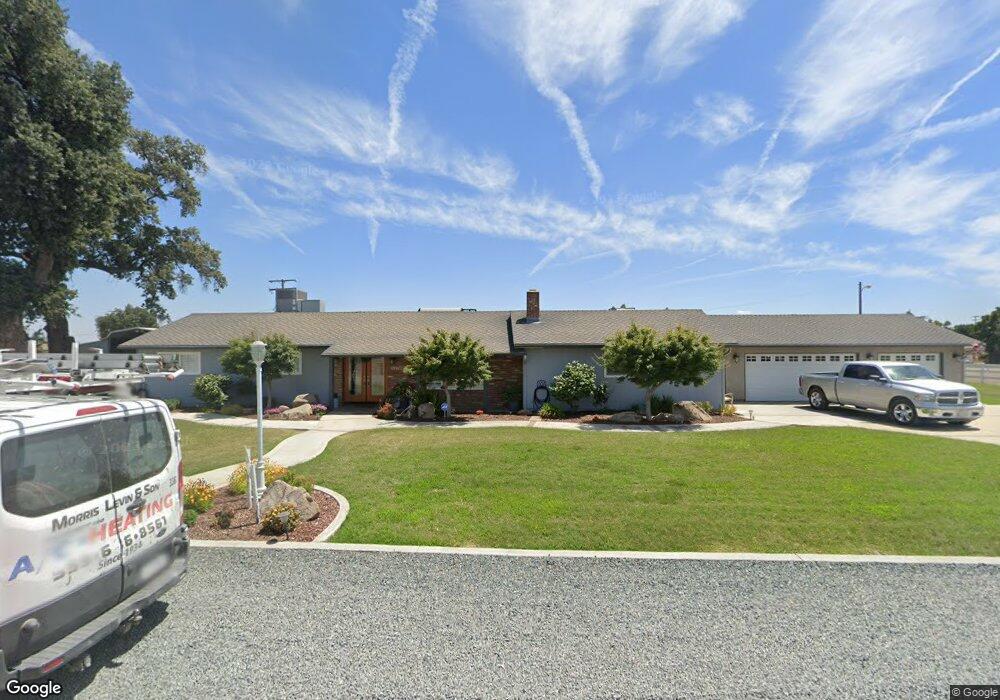
23389 Road 126 Unit C Tulare, CA 93274
Estimated Value: $485,000 - $628,000
3
Beds
2
Baths
1,870
Sq Ft
$295/Sq Ft
Est. Value
About This Home
This home is located at 23389 Road 126 Unit C, Tulare, CA 93274 and is currently estimated at $552,021, approximately $295 per square foot. 23389 Road 126 Unit C is a home located in Tulare County with nearby schools including Sundale Elementary School and Mission Oak High School.
Ownership History
Date
Name
Owned For
Owner Type
Purchase Details
Closed on
Apr 1, 2014
Sold by
Lincicum Michael J and Lincicum Carolyn L
Bought by
Kellogg Susanne M
Current Estimated Value
Purchase Details
Closed on
Nov 17, 2009
Sold by
Sarabia Teresa F
Bought by
Milauckas Joseph W
Home Financials for this Owner
Home Financials are based on the most recent Mortgage that was taken out on this home.
Original Mortgage
$239,089
Interest Rate
5.03%
Mortgage Type
FHA
Purchase Details
Closed on
Nov 16, 2009
Sold by
Milauckas Joseph W
Bought by
Lincicum Michael J and Lincicum Carolyn L
Home Financials for this Owner
Home Financials are based on the most recent Mortgage that was taken out on this home.
Original Mortgage
$239,089
Interest Rate
5.03%
Mortgage Type
FHA
Purchase Details
Closed on
May 5, 2006
Sold by
Sarabia Patricio
Bought by
Milauckas Joseph W and Sarabia Teresa F
Create a Home Valuation Report for This Property
The Home Valuation Report is an in-depth analysis detailing your home's value as well as a comparison with similar homes in the area
Purchase History
| Date | Buyer | Sale Price | Title Company |
|---|---|---|---|
| Kellogg Susanne M | $230,500 | Chicago Title Company | |
| Milauckas Joseph W | -- | Chicago Title Company | |
| Lincicum Michael J | $243,500 | Chicago Title Company | |
| Milauckas Joseph W | -- | Accommodation | |
| Milauckas Joseph W | -- | Accommodation |
Source: Public Records
Mortgage History
| Date | Status | Borrower | Loan Amount |
|---|---|---|---|
| Previous Owner | Lincicum Michael J | $239,089 |
Source: Public Records
Tax History
| Year | Tax Paid | Tax Assessment Tax Assessment Total Assessment is a certain percentage of the fair market value that is determined by local assessors to be the total taxable value of land and additions on the property. | Land | Improvement |
|---|---|---|---|---|
| 2025 | $2,991 | $281,946 | $91,938 | $190,008 |
| 2024 | $2,991 | $276,419 | $90,136 | $186,283 |
| 2023 | $2,914 | $271,000 | $88,369 | $182,631 |
| 2022 | $2,827 | $265,687 | $86,637 | $179,050 |
| 2021 | $2,790 | $260,477 | $84,938 | $175,539 |
| 2020 | $2,838 | $257,806 | $84,067 | $173,739 |
| 2019 | $2,910 | $252,751 | $82,419 | $170,332 |
| 2018 | $2,864 | $247,795 | $80,803 | $166,992 |
| 2017 | $2,838 | $242,937 | $79,219 | $163,718 |
| 2016 | $2,726 | $238,174 | $77,666 | $160,508 |
| 2015 | $3,032 | $234,596 | $76,499 | $158,097 |
| 2014 | $3,032 | $256,404 | $73,710 | $182,694 |
Source: Public Records
Map
Nearby Homes
- 187 Ontario Cir
- 230 Ontario Cir
- 195 Ontario Cir
- 3012 Sand Hills Ave
- 3165 E Sierra Ave
- 3177 E Sierra Ave
- 3137 Ryan Ave
- 3131 Ryan Ave
- 3157 Ryan Ave
- 3151 Ryan Ave
- 3162 Ryan Ave
- 2973 Riviera Ave
- 2936 Crystal Downs Ave
- 31168 Ryan Ave
- 556 N Montana de Oro St
- 2827 Sand Hills Ave
- 187 Montana de Oro St
- 2896 Channel Reef Ave
- 1098 Stonebridge Ave
- 2693 Muirfield Ave
- 23389 Road 126 Unit B
- 23389 Road 126 Unit A
- 250 N Oakmore St
- 276 N Oakmore St
- 12466 Colony Ave
- 12438 Colony Ave
- 300 N Oakmore St
- 12488 Colony Ave
- 12408 Colony Ave
- 2856 N Oakmore St
- 320 N Oakmore St
- 12499 Colony Ave
- 12437 Colony Ave
- 23385 Road 126
- 12522 Colony Ave
- 100 N Oakmore St
- 12501 Colony Ave
- 23393 Road 126
- 12511 Colony Ave
- 3688 E Tulare Ave
Your Personal Tour Guide
Ask me questions while you tour the home.