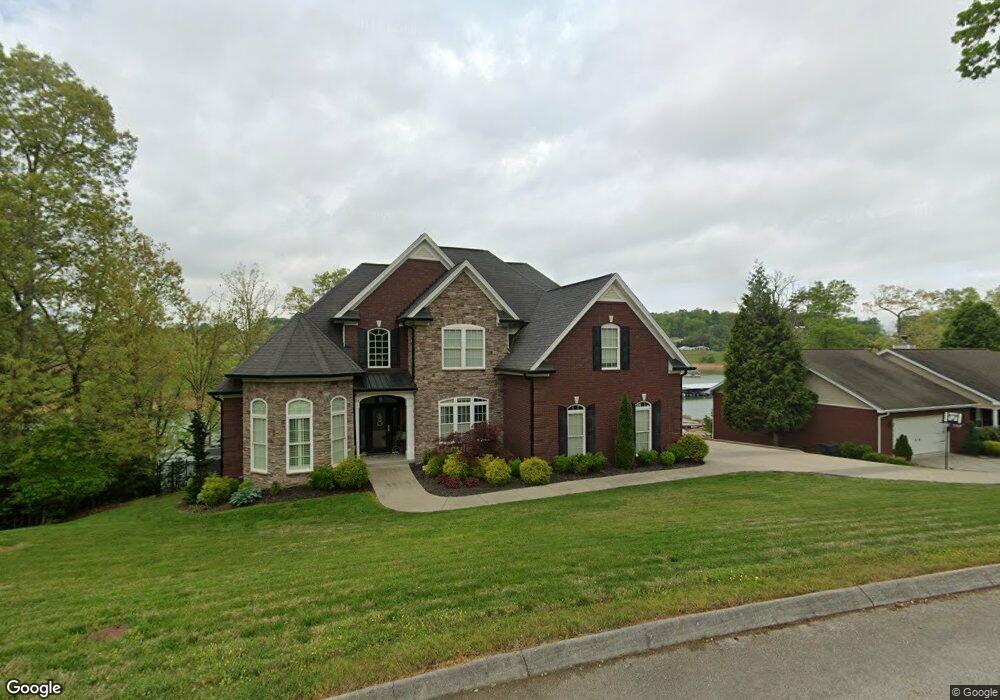
2339 Boat Dock Rd Talbott, TN 37877
Estimated Value: $622,000 - $832,748
4
Beds
4
Baths
3,132
Sq Ft
$232/Sq Ft
Est. Value
About This Home
This home is located at 2339 Boat Dock Rd, Talbott, TN 37877 and is currently estimated at $725,687, approximately $231 per square foot. 2339 Boat Dock Rd is a home located in Hamblen County with nearby schools including Alpha Elementary School, West View Middle School, and Morristown West High School.
Ownership History
Date
Name
Owned For
Owner Type
Purchase Details
Closed on
Mar 29, 2021
Sold by
Barnes Matthew J and Barnes Heather M
Bought by
Smith Bradford M and Smith Lenore H
Current Estimated Value
Home Financials for this Owner
Home Financials are based on the most recent Mortgage that was taken out on this home.
Original Mortgage
$511,200
Outstanding Balance
$456,966
Interest Rate
2.8%
Mortgage Type
New Conventional
Estimated Equity
$268,721
Purchase Details
Closed on
Jun 22, 2010
Sold by
Johnson Paul A
Bought by
Barnes Matthew J
Purchase Details
Closed on
Oct 4, 2005
Sold by
Hensley Robert E
Bought by
Johnson Paul A
Purchase Details
Closed on
May 18, 2000
Sold by
Harrell & Harrell Llc
Bought by
Hensley Robert E
Purchase Details
Closed on
Dec 27, 1991
Bought by
Lambeth Lisa Solod
Purchase Details
Closed on
Nov 23, 1987
Bought by
Solod Jay L
Purchase Details
Closed on
Oct 21, 1970
Bought by
Solod Jay & Fredlyn
Create a Home Valuation Report for This Property
The Home Valuation Report is an in-depth analysis detailing your home's value as well as a comparison with similar homes in the area
Purchase History
| Date | Buyer | Sale Price | Title Company |
|---|---|---|---|
| Smith Bradford M | $639,000 | Colonial Title Group Inc | |
| Barnes Matthew J | $87,500 | -- | |
| Johnson Paul A | $65,000 | -- | |
| Hensley Robert E | $44,900 | -- | |
| Lambeth Lisa Solod | -- | -- | |
| Solod Jay L | -- | -- | |
| Solod Jay & Fredlyn | -- | -- |
Source: Public Records
Mortgage History
| Date | Status | Borrower | Loan Amount |
|---|---|---|---|
| Open | Smith Bradford M | $511,200 |
Source: Public Records
Tax History
| Year | Tax Paid | Tax Assessment Tax Assessment Total Assessment is a certain percentage of the fair market value that is determined by local assessors to be the total taxable value of land and additions on the property. | Land | Improvement |
|---|---|---|---|---|
| 2025 | $2,517 | $171,200 | $19,775 | $151,425 |
| 2024 | $1,878 | $95,350 | $14,000 | $81,350 |
| 2023 | $1,878 | $95,350 | $0 | $0 |
| 2022 | $1,878 | $95,350 | $14,000 | $81,350 |
| 2021 | $1,878 | $95,350 | $14,000 | $81,350 |
| 2020 | $1,648 | $83,650 | $14,000 | $69,650 |
| 2019 | $1,626 | $76,325 | $13,850 | $62,475 |
| 2018 | $1,626 | $76,325 | $13,850 | $62,475 |
| 2017 | $1,626 | $76,325 | $13,850 | $62,475 |
| 2016 | $1,519 | $76,325 | $13,850 | $62,475 |
| 2015 | $1,412 | $76,325 | $13,850 | $62,475 |
| 2014 | -- | $76,325 | $13,850 | $62,475 |
| 2013 | -- | $84,200 | $0 | $0 |
Source: Public Records
Map
Nearby Homes
- 0 Lowe Dr
- Lot 1R1 Lowe Dr
- 6265 Panther Creek Rd
- 2830 Lowe Dr
- 7167 Cedar Hill Rd
- 7474 Evolene Cir
- 1533 Allen Rd
- 6130 James Cline Rd
- 1154 Lakeshore Rd
- 6161 Hiawatha Rd
- 2107 Windy Cove Ln
- 0 Collinson Ford Rd
- 1423 Guinn Rd
- 1950 Seven Oaks Dr
- 1167 Cherry Blossom Ln
- 1109 Cherry Blossom Ln
- 6282 Golden Dr
- 7242 Cherrybrook Ln
- 6152 Silver Fox Trail
- 6153 Silver Fox Trail
- 2333 Boat Dock Rd
- 2345 Boat Dock Rd
- 2334 Boat Dock Rd
- 2327 Boat Dock Rd
- 2320 Boat Dock Rd
- 2319 Boat Dock Rd
- 2354 Boat Dock Rd
- 2301 Boat Dock Rd
- 2372 Boat Dock Rd
- 2293 Boat Dock Rd
- 2369 Boat Dock Rd
- 2388 Boat Dock Rd
- 2273 Boat Dock Rd
- 2483 Boat Dock Rd
- 2235 Boat Dock Rd
- 2400 Boat Dock Rd
- 2375 Boat Dock Rd
- 2381 Boat Dock Rd
- 2385 Boat Dock Rd
- 2477 Boat Dock Rd
Your Personal Tour Guide
Ask me questions while you tour the home.