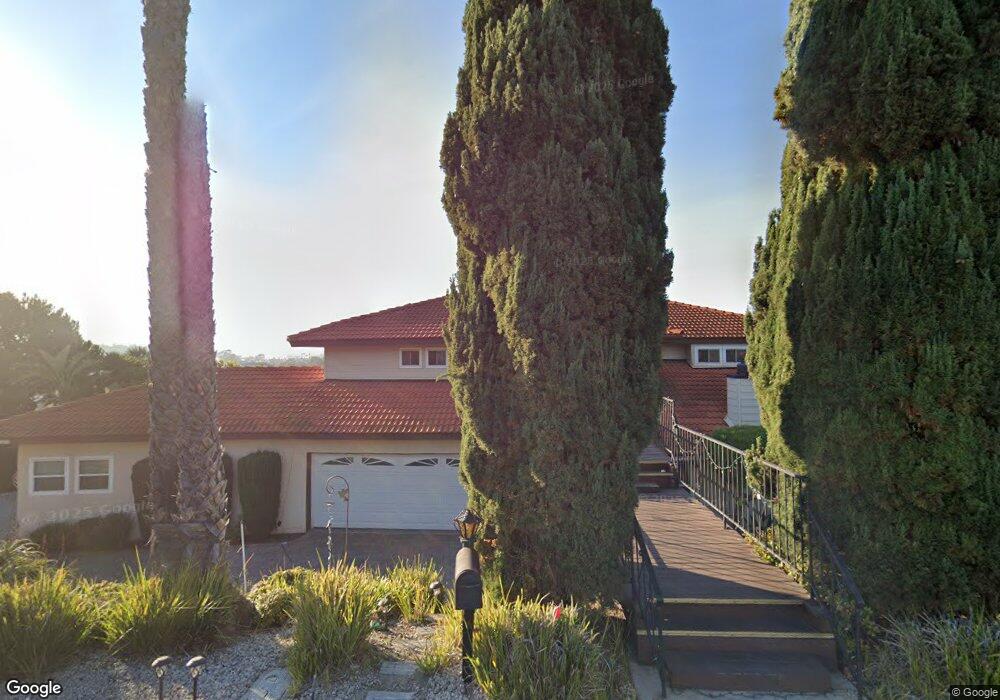
2339 Hogan Way Oceanside, CA 92056
Mira Costa NeighborhoodEstimated Value: $1,198,000 - $1,562,000
4
Beds
4
Baths
3,771
Sq Ft
$382/Sq Ft
Est. Value
About This Home
This home is located at 2339 Hogan Way, Oceanside, CA 92056 and is currently estimated at $1,439,209, approximately $381 per square foot. 2339 Hogan Way is a home located in San Diego County with nearby schools including Palmquist Elementary School, Martin Luther King Jr. Middle School, and El Camino High School.
Ownership History
Date
Name
Owned For
Owner Type
Purchase Details
Closed on
Jan 6, 2021
Sold by
Jioras Robert G and Jioras 2006 Family Trust
Bought by
Jioras Robert G
Current Estimated Value
Home Financials for this Owner
Home Financials are based on the most recent Mortgage that was taken out on this home.
Original Mortgage
$260,000
Outstanding Balance
$232,051
Interest Rate
2.71%
Mortgage Type
New Conventional
Estimated Equity
$1,207,158
Purchase Details
Closed on
Aug 17, 2006
Sold by
Jioras Robert G and Jioras Charlene M
Bought by
Jioras Robert G and Jioras Charlene M
Purchase Details
Closed on
Jan 11, 1985
Create a Home Valuation Report for This Property
The Home Valuation Report is an in-depth analysis detailing your home's value as well as a comparison with similar homes in the area
Home Values in the Area
Average Home Value in this Area
Purchase History
| Date | Buyer | Sale Price | Title Company |
|---|---|---|---|
| Jioras Robert G | -- | Ticor Title | |
| Jioras Robert G | -- | Ticor Title Sd Branch | |
| Jioras Robert G | -- | None Available | |
| -- | $235,000 | -- |
Source: Public Records
Mortgage History
| Date | Status | Borrower | Loan Amount |
|---|---|---|---|
| Open | Jioras Robert G | $260,000 |
Source: Public Records
Tax History
| Year | Tax Paid | Tax Assessment Tax Assessment Total Assessment is a certain percentage of the fair market value that is determined by local assessors to be the total taxable value of land and additions on the property. | Land | Improvement |
|---|---|---|---|---|
| 2025 | $5,192 | $477,304 | $71,650 | $405,654 |
| 2024 | $5,192 | $467,946 | $70,246 | $397,700 |
| 2023 | $5,031 | $458,771 | $68,869 | $389,902 |
| 2022 | $4,953 | $449,776 | $67,519 | $382,257 |
| 2021 | $4,971 | $440,958 | $66,196 | $374,762 |
| 2020 | $4,817 | $436,438 | $65,518 | $370,920 |
| 2019 | $4,675 | $427,882 | $64,234 | $363,648 |
| 2018 | $4,624 | $419,493 | $62,975 | $356,518 |
| 2017 | $4,538 | $411,269 | $61,741 | $349,528 |
| 2016 | $4,389 | $403,206 | $60,531 | $342,675 |
| 2015 | $4,260 | $397,150 | $59,622 | $337,528 |
| 2014 | $4,094 | $389,372 | $58,455 | $330,917 |
Source: Public Records
Map
Nearby Homes
- 2360 Paseo de Laura Unit 2
- 2360 Paseo de Laura Unit 1
- 2210 Valley Rd
- 3315 Tripoli Way
- 3328 Malta Way
- 0 Oceanview Rd Unit NDP2504901
- 3349 Par Dr
- 3529 Santa Maria St
- 3459 Paseo de Alicia Unit 20
- 3553 Paseo de Francisco Unit 209
- 3325 Genoa Way Unit 110
- 3315 Genoa Way Unit 96
- 3547 Mira Pacific Dr
- 3365 Genoa Way Unit 135
- 3335 Genoa Way Unit 112
- 2335 Cartegena Way
- 3376 Corsica Way
- 2128 Via Sonora
- 2340 Hosp Way Unit 120
- 2360 Hosp Way Unit 229
- 2341 Hogan Way
- 2337 Hogan Way
- 2352 Nicklaus Dr
- 2354 Nicklaus Dr
- 2350 Nicklaus Dr
- 2356 Nicklaus Dr
- 2342 Hogan Way
- 2348 Nicklaus Dr
- 2358 Nicklaus Dr
- 2360 Nicklaus Dr
- 2335 Hogan Way
- 2343 Hogan Way
- 2362 Nicklaus Dr
- 2347 Nicklaus Dr
- 2341 Snead Dr
- 2349 Nicklaus Dr Unit 1
- 2349 Nicklaus Dr
- 2345 Nicklaus Dr
- 2343 Nicklaus Dr
- 2311 Nicklaus Dr
Your Personal Tour Guide
Ask me questions while you tour the home.