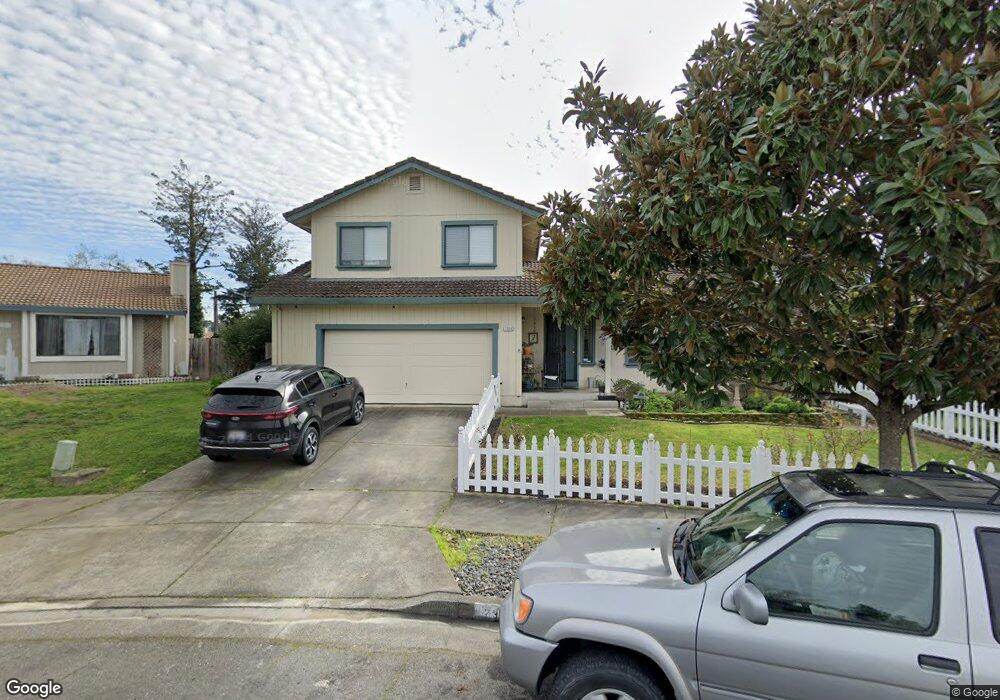
2339 Mandarin Ln Santa Rosa, CA 95401
Northwest Santa Rosa NeighborhoodEstimated Value: $678,862 - $770,000
3
Beds
3
Baths
1,584
Sq Ft
$449/Sq Ft
Est. Value
About This Home
This home is located at 2339 Mandarin Ln, Santa Rosa, CA 95401 and is currently estimated at $711,716, approximately $449 per square foot. 2339 Mandarin Ln is a home located in Sonoma County with nearby schools including Albert F. Biella Elementary School, Hilliard Comstock Middle School, and Santa Rosa High School.
Ownership History
Date
Name
Owned For
Owner Type
Purchase Details
Closed on
Jun 18, 2013
Sold by
Dockery William and Dockery Cindy A
Bought by
The Dockery Family Trust
Current Estimated Value
Purchase Details
Closed on
Nov 16, 1998
Sold by
Dick William T and Dick Teresa M
Bought by
Dockery William and Dockery Cindy A
Home Financials for this Owner
Home Financials are based on the most recent Mortgage that was taken out on this home.
Original Mortgage
$156,000
Outstanding Balance
$33,543
Interest Rate
6.42%
Estimated Equity
$678,173
Purchase Details
Closed on
Feb 25, 1994
Sold by
Nichols Jeremy Dwight and Nichols Laura Cline
Bought by
Dick William T and Dick Teresa M
Home Financials for this Owner
Home Financials are based on the most recent Mortgage that was taken out on this home.
Original Mortgage
$162,180
Interest Rate
7.09%
Mortgage Type
Assumption
Create a Home Valuation Report for This Property
The Home Valuation Report is an in-depth analysis detailing your home's value as well as a comparison with similar homes in the area
Home Values in the Area
Average Home Value in this Area
Purchase History
| Date | Buyer | Sale Price | Title Company |
|---|---|---|---|
| The Dockery Family Trust | -- | None Available | |
| Dockery William | $195,000 | North Bay Title Co | |
| Dick William T | $159,000 | North Bay Title Co |
Source: Public Records
Mortgage History
| Date | Status | Borrower | Loan Amount |
|---|---|---|---|
| Open | Dockery William | $156,000 | |
| Previous Owner | Dick William T | $162,180 |
Source: Public Records
Tax History Compared to Growth
Tax History
| Year | Tax Paid | Tax Assessment Tax Assessment Total Assessment is a certain percentage of the fair market value that is determined by local assessors to be the total taxable value of land and additions on the property. | Land | Improvement |
|---|---|---|---|---|
| 2025 | $3,389 | $305,693 | $109,731 | $195,962 |
| 2024 | $3,389 | $299,700 | $107,580 | $192,120 |
| 2023 | $3,389 | $293,824 | $105,471 | $188,353 |
| 2022 | $3,128 | $288,063 | $103,403 | $184,660 |
| 2021 | $3,088 | $282,416 | $101,376 | $181,040 |
| 2020 | $3,081 | $279,521 | $100,337 | $179,184 |
| 2019 | $3,063 | $274,041 | $98,370 | $175,671 |
| 2018 | $3,045 | $268,669 | $96,442 | $172,227 |
| 2017 | $2,989 | $263,401 | $94,551 | $168,850 |
| 2016 | $2,961 | $258,238 | $92,698 | $165,540 |
| 2015 | $2,871 | $254,360 | $91,306 | $163,054 |
| 2014 | $2,694 | $249,378 | $89,518 | $159,860 |
Source: Public Records
Map
Nearby Homes
- 2291 Truckee Dr
- 1169 Putney Dr
- 2318 S Hampton Cir
- 66 Somerset Dr
- 141 Stratford Way
- 1380 Velma Ave
- 2467 College Park Cir
- 2484 College Park Cir
- 1520 Cabernet Cir
- 2311 Guerneville Rd
- 234 Arboleda Dr
- 167 Sequoia Cir
- 2423 Guerneville Rd
- 1532 Pinebrook Place
- 1617 Gamay St
- 1552 Moonview Ct
- 1507 Pinebrook Place
- 1516 Wadsworth Ct
- 1626 Woodhue Ave
- 1744 Marlow Rd
- 2341 Mandarin Ln
- 2337 Mandarin Ln
- 2343 Mandarin Ln
- 2335 Mandarin Ln
- 2345 Mandarin Ln
- 2333 Mandarin Ln
- 2347 Mandarin Ln
- 2324 W College Ave
- 2333 W College Ave
- 2331 Mandarin Ln
- 2349 Mandarin Ln
- 2328 W College Ave
- 1103 Halyard Dr
- 1107 Halyard Dr
- 2320 W College Ave
- 2329 Mandarin Ln
- 1111 Halyard Dr
- 2351 Mandarin Ln
- 2328 Mandarin Ln
- 2334 W College Ave