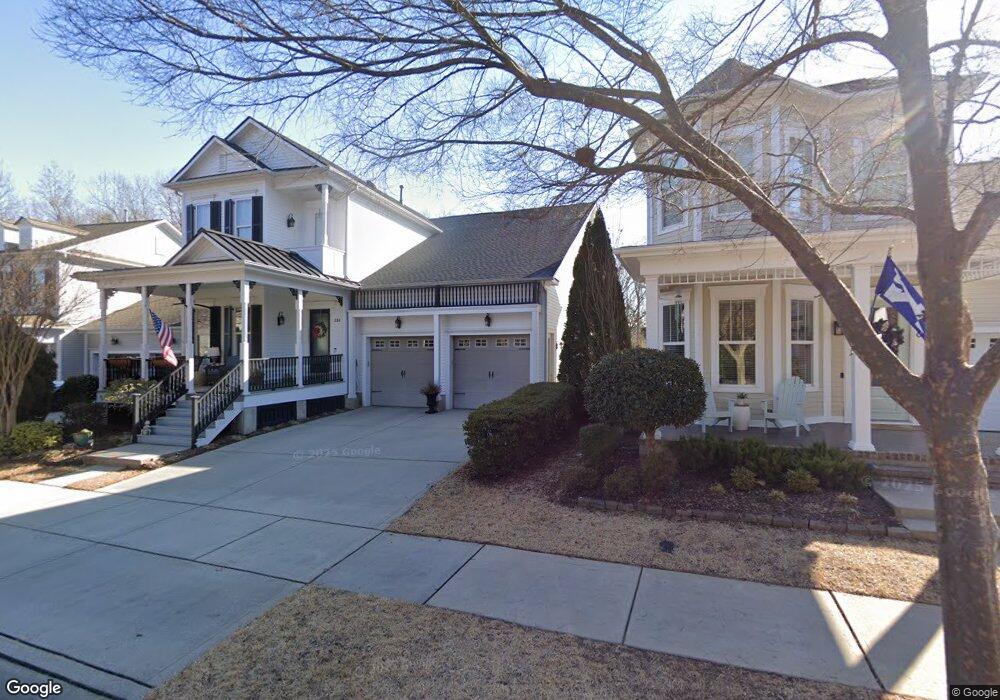
234 Crowded Roots Rd Unit 4 Fort Mill, SC 29715
Springfield NeighborhoodEstimated Value: $791,887 - $1,026,000
3
Beds
4
Baths
3,373
Sq Ft
$265/Sq Ft
Est. Value
About This Home
This home is located at 234 Crowded Roots Rd Unit 4, Fort Mill, SC 29715 and is currently estimated at $893,472, approximately $264 per square foot. 234 Crowded Roots Rd Unit 4 is a home located in York County with nearby schools including Fort Mill Elementary School, Fort Mill Middle School, and Nation Ford High School.
Ownership History
Date
Name
Owned For
Owner Type
Purchase Details
Closed on
Sep 28, 2017
Sold by
Paterson James R and Paterson Maureen E
Bought by
Steely Thomas L and Steely Doe F
Current Estimated Value
Purchase Details
Closed on
Aug 13, 2010
Sold by
Zant David B and Zant Katherine L
Bought by
Paterson James R and Paterson Maureen E
Home Financials for this Owner
Home Financials are based on the most recent Mortgage that was taken out on this home.
Original Mortgage
$320,000
Interest Rate
4.25%
Mortgage Type
New Conventional
Purchase Details
Closed on
Jul 1, 2008
Sold by
Ounnane Group Inc
Bought by
Zant David B and Zant Katherine L
Home Financials for this Owner
Home Financials are based on the most recent Mortgage that was taken out on this home.
Original Mortgage
$376,000
Interest Rate
6.27%
Mortgage Type
New Conventional
Create a Home Valuation Report for This Property
The Home Valuation Report is an in-depth analysis detailing your home's value as well as a comparison with similar homes in the area
Home Values in the Area
Average Home Value in this Area
Purchase History
| Date | Buyer | Sale Price | Title Company |
|---|---|---|---|
| Steely Thomas L | $510,000 | None Available | |
| Paterson James R | $400,000 | -- | |
| Zant David B | $470,000 | -- |
Source: Public Records
Mortgage History
| Date | Status | Borrower | Loan Amount |
|---|---|---|---|
| Previous Owner | Paterson James R | $320,000 | |
| Previous Owner | Zant David B | $376,000 |
Source: Public Records
Tax History Compared to Growth
Tax History
| Year | Tax Paid | Tax Assessment Tax Assessment Total Assessment is a certain percentage of the fair market value that is determined by local assessors to be the total taxable value of land and additions on the property. | Land | Improvement |
|---|---|---|---|---|
| 2024 | $3,872 | $17,860 | $3,600 | $14,260 |
| 2023 | $3,786 | $17,859 | $3,600 | $14,259 |
| 2022 | $4,130 | $17,859 | $3,600 | $14,259 |
| 2021 | -- | $17,859 | $3,600 | $14,259 |
| 2020 | $4,299 | $17,859 | $0 | $0 |
| 2019 | $5,309 | $19,080 | $0 | $0 |
| 2018 | $14,651 | $28,620 | $0 | $0 |
| 2017 | $4,424 | $19,080 | $0 | $0 |
| 2016 | $4,408 | $15,780 | $0 | $0 |
| 2014 | $3,496 | $15,780 | $2,200 | $13,580 |
| 2013 | $3,496 | $16,260 | $2,000 | $14,260 |
Source: Public Records
Map
Nearby Homes
- 126 Gragg House Rd
- 238 Cherrytree Dr
- 918 Kirby Dr
- 910 Kirby Dr
- 689 Birchway Dr
- 685 Birchway Dr
- 673 Birchway Dr
- 253 Buckner Hill Ln
- 744 Birchway Dr
- 945 Vogel Way
- 524 Becker Ave
- 1021 Kirby Dr
- 637 Birchway Dr
- 312 Harvest Valley Ln
- 1009 Regal Manor Ln
- 1266 Lange Ct
- 7216 Meyer Rd
- 1290 Lange Ct
- 353 Harvest Valley Ln
- 276 Grovefield Dr
- 234 Crowded Roots Rd
- 230 Crowded Roots Rd
- 230 Crowded Roots Rd Unit 5
- 238 Crowded Roots Rd
- 226 Crowded Roots Rd
- 242 Crowded Roots Rd
- 242 Crowded Roots Rd Unit 2
- 222 Crowded Roots Rd
- 246 Crowded Roots Rd
- 218 Crowded Roots Rd
- 214 Crowded Roots Rd Unit 9
- 306 Horton Grove Rd
- 210 Crowded Roots Rd
- 210 Crowded Roots Rd Unit 10
- 206 Crowded Roots Rd
- 310 Horton Grove Rd
- 301 Horton Grove Rd
- 297 Horton Grove Rd
- 305 Horton Grove Rd
- 309 Horton Grove Rd