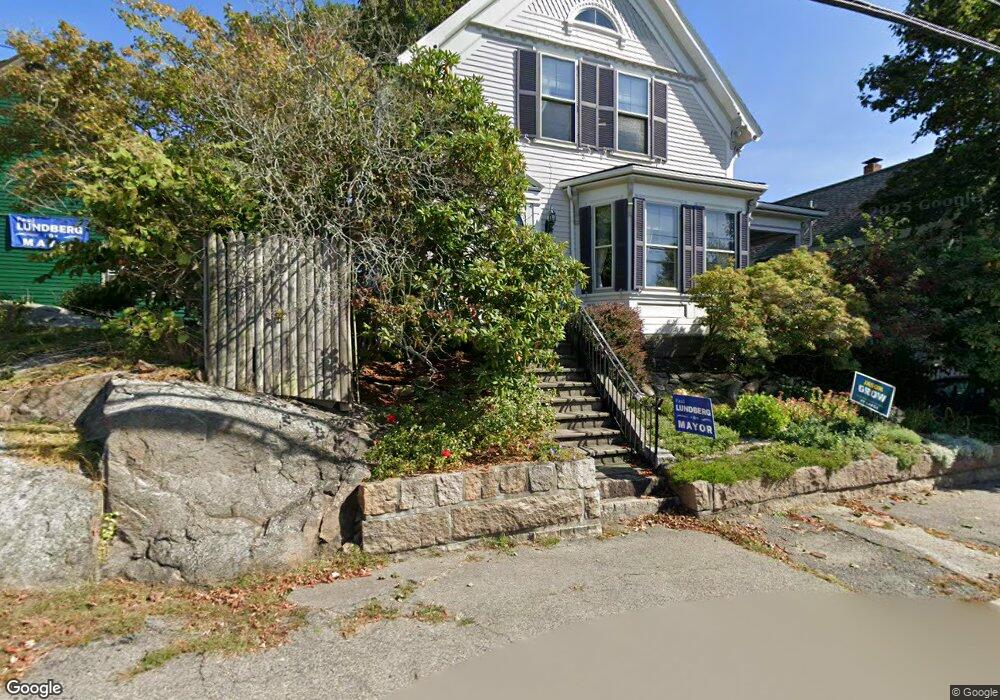
234 E Main St Gloucester, MA 01930
East Gloucester NeighborhoodEstimated Value: $657,000 - $1,089,000
3
Beds
2
Baths
1,367
Sq Ft
$618/Sq Ft
Est. Value
About This Home
This home is located at 234 E Main St, Gloucester, MA 01930 and is currently estimated at $844,245, approximately $617 per square foot. 234 E Main St is a home located in Essex County with nearby schools including East Gloucester Elementary School, Ralph B O'maley Middle School, and Gloucester High School.
Ownership History
Date
Name
Owned For
Owner Type
Purchase Details
Closed on
May 31, 2000
Sold by
Mcowen John William and Love-Mcowen Sarah
Bought by
Beck Mary H and Busse Wilma J
Current Estimated Value
Purchase Details
Closed on
Mar 19, 1996
Sold by
Jennylil Rt
Bought by
Johnson Jerry and Johnson Betsy
Create a Home Valuation Report for This Property
The Home Valuation Report is an in-depth analysis detailing your home's value as well as a comparison with similar homes in the area
Home Values in the Area
Average Home Value in this Area
Purchase History
| Date | Buyer | Sale Price | Title Company |
|---|---|---|---|
| Beck Mary H | $300,000 | -- | |
| Johnson Jerry | $150,000 | -- |
Source: Public Records
Mortgage History
| Date | Status | Borrower | Loan Amount |
|---|---|---|---|
| Open | Johnson Jerry | $141,500 | |
| Closed | Johnson Jerry | $113,000 | |
| Closed | Johnson Jerry | $100,000 |
Source: Public Records
Tax History
| Year | Tax Paid | Tax Assessment Tax Assessment Total Assessment is a certain percentage of the fair market value that is determined by local assessors to be the total taxable value of land and additions on the property. | Land | Improvement |
|---|---|---|---|---|
| 2025 | $6,169 | $634,700 | $212,800 | $421,900 |
| 2024 | $6,076 | $624,500 | $202,600 | $421,900 |
| 2023 | $5,814 | $549,000 | $180,900 | $368,100 |
| 2022 | $5,580 | $475,700 | $153,800 | $321,900 |
| 2021 | $5,380 | $432,500 | $139,800 | $292,700 |
| 2020 | $5,287 | $428,800 | $139,800 | $289,000 |
| 2019 | $5,119 | $403,400 | $139,800 | $263,600 |
| 2018 | $4,895 | $378,600 | $139,800 | $238,800 |
| 2017 | $4,740 | $359,400 | $133,100 | $226,300 |
| 2016 | $4,548 | $334,200 | $133,600 | $200,600 |
| 2015 | $4,349 | $318,600 | $133,600 | $185,000 |
Source: Public Records
Map
Nearby Homes
- 1 Wonson St
- 73 Rocky Neck Ave Unit 2
- 60 Rocky Neck Ave Unit 202
- 197 E Main St Unit 1
- 15 Raven Ln Unit 15
- 10 Seaview Rd
- 11 Ocean View Dr
- 191 Main St Unit 3
- 191 Main St Unit 2A
- 139A Prospect St
- 35 Middle St Unit 4
- 33 Middle St
- 3 Mondello Square
- 15 Mount Vernon St
- 36 Eastern Ave
- 113 Pleasant St
- 50 Warner St
- 33 Maplewood Ave Unit 310
- 87 Atlantic Rd Unit 2
- 5 Wise Place
- 236 E Main St
- 3 Gerring Rd
- 1 Barberry Ln
- 3 Barberry Ln
- 238 E Main St
- 261 E Main St Unit 7&8
- 261 E Main St
- 261 E Main St
- 259 E Main St
- 259 E Main St
- 7 Barberry Ln
- 230 E Main St
- 263 E Main St
- 7 Gerring Rd
- 240 E Main St
- 4 Gerring Rd
- 145 Mount Pleasant Ave
- 143 Mount Pleasant Ave
- 228 E Main St
- 6 Gerring Rd
Your Personal Tour Guide
Ask me questions while you tour the home.