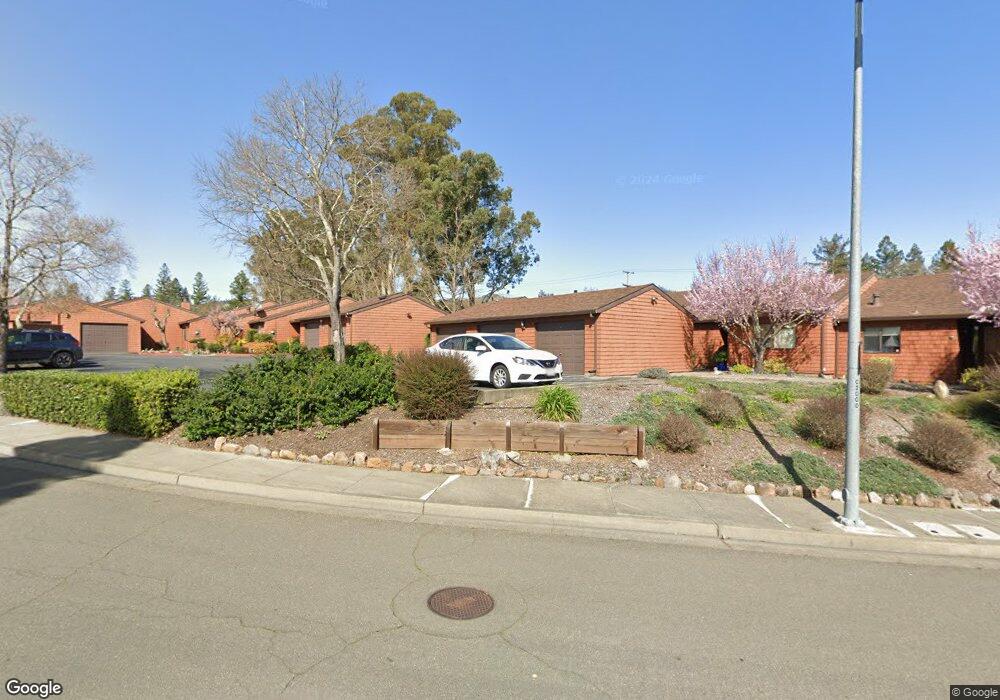
234 Indian Creek Dr Unit 16 Santa Rosa, CA 95409
Estimated Value: $492,488 - $561,000
2
Beds
2
Baths
1,246
Sq Ft
$424/Sq Ft
Est. Value
About This Home
This home is located at 234 Indian Creek Dr Unit 16, Santa Rosa, CA 95409 and is currently estimated at $528,872, approximately $424 per square foot. 234 Indian Creek Dr Unit 16 is a home located in Sonoma County with nearby schools including Rincon Valley Middle School, Maria Carrillo High School, and Whited Elementary Charter School.
Ownership History
Date
Name
Owned For
Owner Type
Purchase Details
Closed on
Oct 12, 2021
Sold by
Moss R Lawrence
Bought by
Moss R Lawrence and R Lawrence Moss Revocable Trus
Current Estimated Value
Purchase Details
Closed on
Sep 7, 2017
Sold by
Moss R Lawrence and Moss David R
Bought by
Moss R Lawrence
Purchase Details
Closed on
Nov 30, 2005
Sold by
Moss Laura M and Corse Laura Moss
Bought by
Corse Laura Moss and The Laura Moss Corse Trust Agr
Purchase Details
Closed on
Jan 29, 1999
Sold by
Skakel Jean L and Atnip Steven Edward
Bought by
Moss Laura M
Home Financials for this Owner
Home Financials are based on the most recent Mortgage that was taken out on this home.
Original Mortgage
$80,000
Outstanding Balance
$18,919
Interest Rate
6.73%
Estimated Equity
$509,953
Create a Home Valuation Report for This Property
The Home Valuation Report is an in-depth analysis detailing your home's value as well as a comparison with similar homes in the area
Home Values in the Area
Average Home Value in this Area
Purchase History
| Date | Buyer | Sale Price | Title Company |
|---|---|---|---|
| Moss R Lawrence | -- | None Available | |
| Moss R Lawrence | -- | None Available | |
| Corse Laura Moss | -- | None Available | |
| Moss Laura M | $130,000 | First American Title |
Source: Public Records
Mortgage History
| Date | Status | Borrower | Loan Amount |
|---|---|---|---|
| Open | Moss Laura M | $80,000 |
Source: Public Records
Tax History Compared to Growth
Tax History
| Year | Tax Paid | Tax Assessment Tax Assessment Total Assessment is a certain percentage of the fair market value that is determined by local assessors to be the total taxable value of land and additions on the property. | Land | Improvement |
|---|---|---|---|---|
| 2025 | $2,462 | $203,789 | $70,539 | $133,250 |
| 2024 | $2,462 | $199,794 | $69,156 | $130,638 |
| 2023 | $2,462 | $195,877 | $67,800 | $128,077 |
| 2022 | $2,277 | $192,037 | $66,471 | $125,566 |
| 2021 | $2,232 | $188,272 | $65,168 | $123,104 |
| 2020 | $2,224 | $186,342 | $64,500 | $121,842 |
| 2019 | $2,203 | $182,689 | $63,236 | $119,453 |
| 2018 | $2,188 | $179,108 | $61,997 | $117,111 |
| 2017 | $2,067 | $175,597 | $60,782 | $114,815 |
| 2016 | $2,036 | $172,155 | $59,591 | $112,564 |
| 2015 | $1,974 | $169,570 | $58,696 | $110,874 |
| 2014 | $1,980 | $166,250 | $57,547 | $108,703 |
Source: Public Records
Map
Nearby Homes
- 206 Indian Creek Dr
- 5086 Charmian Dr
- 5020 Roma St
- 5088 Firestone Ct
- 4746 Bridle Trail
- 5056 Fravel Ln
- 5015 Charmian Dr
- 4704 Venti Ln
- 311 Algiers Ct
- 305 Simone Place N
- Cottage 2 Plan at Acacia Village
- Cottage 1 Plan at Acacia Village
- Two-Story Plan at Acacia Village
- 5426 Spring Lake Ct
- 184 El Encanto Way
- 48 Cardinal Way
- 305 Hansbery Way
- 5534 Rainbow Cir
- 4705 Culebra Way
- 5682 Raters Dr
- 236 Indian Creek Dr
- 232 Indian Creek Dr Unit 15
- 230 Indian Creek Dr
- 228 Indian Creek Dr
- 202 Maria Ln
- 210 Maria Ln
- 224 Indian Creek Dr Unit 11
- 231 Indian Creek Dr Unit 21
- 233 Indian Creek Dr Unit 20
- 235 Indian Creek Dr
- 240 Maria Ln
- 5022 Buckthorn Ct
- 237 Indian Creek Dr Unit 18
- 227 Indian Creek Dr
- 5040 Alana Dr
- 5028 Buckthorn Ct
- 5018 Buckthorn Ct
- 225 Indian Creek Dr