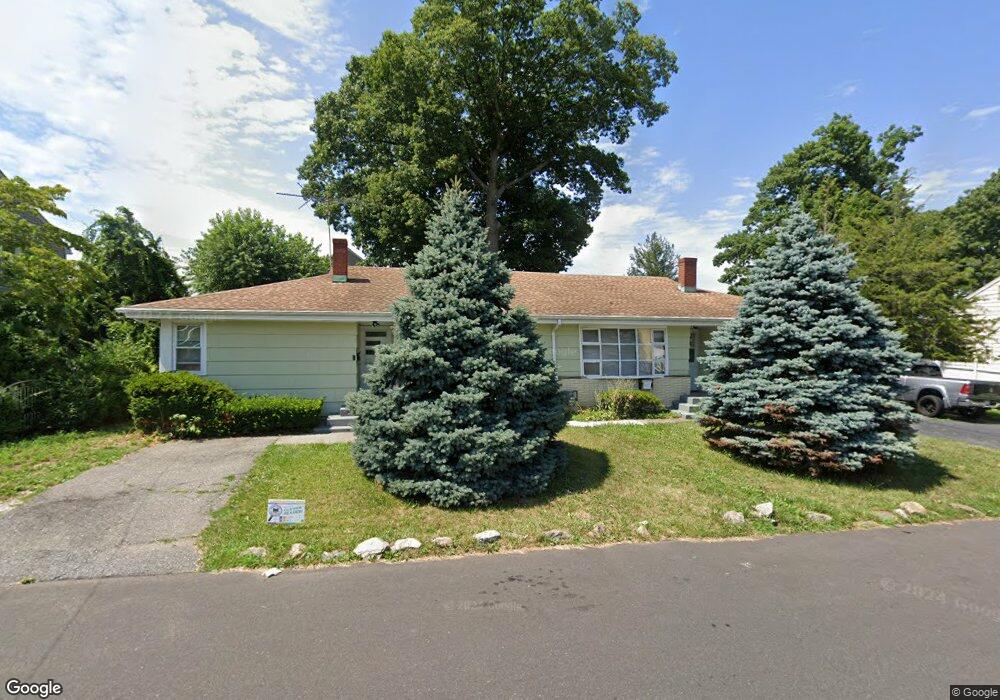
234 Queen St Bridgeport, CT 06606
North End NeighborhoodEstimated Value: $407,000 - $634,000
4
Beds
2
Baths
2,094
Sq Ft
$253/Sq Ft
Est. Value
About This Home
This home is located at 234 Queen St, Bridgeport, CT 06606 and is currently estimated at $528,748, approximately $252 per square foot. 234 Queen St is a home located in Fairfield County with nearby schools including Blackham School, Central High School, and St Andrew School.
Ownership History
Date
Name
Owned For
Owner Type
Purchase Details
Closed on
Oct 2, 1998
Sold by
Kryskiewicz Chester and Kryskiewicz Joan
Bought by
Branco Irene and Branco Adriano
Current Estimated Value
Home Financials for this Owner
Home Financials are based on the most recent Mortgage that was taken out on this home.
Original Mortgage
$65,000
Outstanding Balance
$14,219
Interest Rate
6.89%
Estimated Equity
$514,529
Create a Home Valuation Report for This Property
The Home Valuation Report is an in-depth analysis detailing your home's value as well as a comparison with similar homes in the area
Home Values in the Area
Average Home Value in this Area
Purchase History
| Date | Buyer | Sale Price | Title Company |
|---|---|---|---|
| Branco Irene | $127,000 | -- | |
| Branco Irene | $127,000 | -- |
Source: Public Records
Mortgage History
| Date | Status | Borrower | Loan Amount |
|---|---|---|---|
| Open | Branco Irene | $65,000 | |
| Closed | Branco Irene | $65,000 |
Source: Public Records
Tax History
| Year | Tax Paid | Tax Assessment Tax Assessment Total Assessment is a certain percentage of the fair market value that is determined by local assessors to be the total taxable value of land and additions on the property. | Land | Improvement |
|---|---|---|---|---|
| 2025 | $9,447 | $217,420 | $77,870 | $139,550 |
| 2024 | $9,447 | $217,420 | $77,870 | $139,550 |
| 2023 | $9,447 | $217,420 | $77,870 | $139,550 |
| 2022 | $9,447 | $217,420 | $77,870 | $139,550 |
| 2021 | $9,447 | $217,420 | $77,870 | $139,550 |
| 2020 | $8,261 | $153,010 | $44,740 | $108,270 |
| 2019 | $8,261 | $153,010 | $44,740 | $108,270 |
| 2018 | $8,319 | $153,010 | $44,740 | $108,270 |
| 2017 | $8,319 | $153,010 | $44,740 | $108,270 |
| 2016 | $8,319 | $153,010 | $44,740 | $108,270 |
| 2015 | $8,663 | $205,280 | $51,700 | $153,580 |
| 2014 | $8,663 | $205,280 | $51,700 | $153,580 |
Source: Public Records
Map
Nearby Homes
- 339 Goldenrod Ave
- 316 Goldenrod Ave
- 1095 Wayne St
- 120 Clark St
- 604 Birmingham St
- 3461 Main St
- 578 Beechmont Ave
- 574 Thorme St
- 605 Merritt St
- 315 Tesiny Ave
- 200 Woodmont Ave Unit 121
- 619 Queen St
- 26 Marsdale Ave
- 333 Vincellette St Unit 8
- 533 Glendale Ave
- 234 Savoy St
- 288 Sunrise Terrace
- 495 Vincellette St Unit 12
- 720 Queen St
- 490 Woodside Ave
Your Personal Tour Guide
Ask me questions while you tour the home.