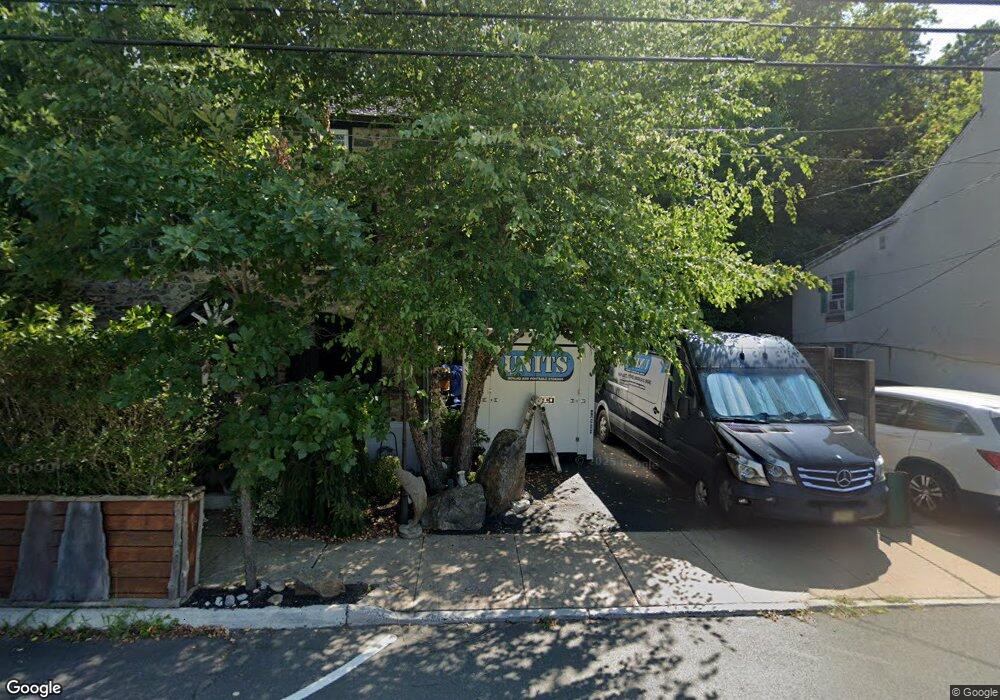
234 S Main St Unit T Lambertville, NJ 08530
Estimated Value: $455,140 - $639,000
--
Bed
--
Bath
1,722
Sq Ft
$303/Sq Ft
Est. Value
About This Home
This home is located at 234 S Main St Unit T, Lambertville, NJ 08530 and is currently estimated at $522,535, approximately $303 per square foot. 234 S Main St Unit T is a home located in Hunterdon County with nearby schools including South Hunterdon Regional Elementary School, South Hunterdon High School, and The Jesus School.
Ownership History
Date
Name
Owned For
Owner Type
Purchase Details
Closed on
Jul 16, 2007
Sold by
Myers Roy D and Myers Bernadette
Bought by
Baran William P
Current Estimated Value
Home Financials for this Owner
Home Financials are based on the most recent Mortgage that was taken out on this home.
Original Mortgage
$195,000
Outstanding Balance
$142,152
Interest Rate
10%
Mortgage Type
Purchase Money Mortgage
Estimated Equity
$380,383
Purchase Details
Closed on
Dec 12, 1996
Sold by
Myers Roy D and Myers Bernadette
Bought by
Myers Roy D and Myers Bernadette
Create a Home Valuation Report for This Property
The Home Valuation Report is an in-depth analysis detailing your home's value as well as a comparison with similar homes in the area
Home Values in the Area
Average Home Value in this Area
Purchase History
| Date | Buyer | Sale Price | Title Company |
|---|---|---|---|
| Baran William P | $325,000 | Weichert Title Agency | |
| Myers Roy D | -- | -- |
Source: Public Records
Mortgage History
| Date | Status | Borrower | Loan Amount |
|---|---|---|---|
| Open | Baran William P | $195,000 |
Source: Public Records
Tax History Compared to Growth
Tax History
| Year | Tax Paid | Tax Assessment Tax Assessment Total Assessment is a certain percentage of the fair market value that is determined by local assessors to be the total taxable value of land and additions on the property. | Land | Improvement |
|---|---|---|---|---|
| 2025 | $7,846 | $347,300 | $184,800 | $162,500 |
| 2024 | $7,848 | $339,500 | $179,800 | $159,700 |
| 2023 | $7,848 | $335,100 | $176,800 | $158,300 |
| 2022 | $7,672 | $332,100 | $173,800 | $158,300 |
| 2021 | $6,925 | $332,100 | $173,800 | $158,300 |
| 2020 | $7,376 | $332,100 | $173,800 | $158,300 |
| 2019 | $6,925 | $327,100 | $168,800 | $158,300 |
| 2018 | $6,820 | $327,100 | $168,800 | $158,300 |
| 2017 | $6,666 | $326,600 | $168,300 | $158,300 |
| 2016 | $6,515 | $325,600 | $167,300 | $158,300 |
| 2015 | $6,438 | $319,200 | $162,300 | $156,900 |
| 2014 | $6,362 | $319,200 | $162,300 | $156,900 |
Source: Public Records
Map
Nearby Homes