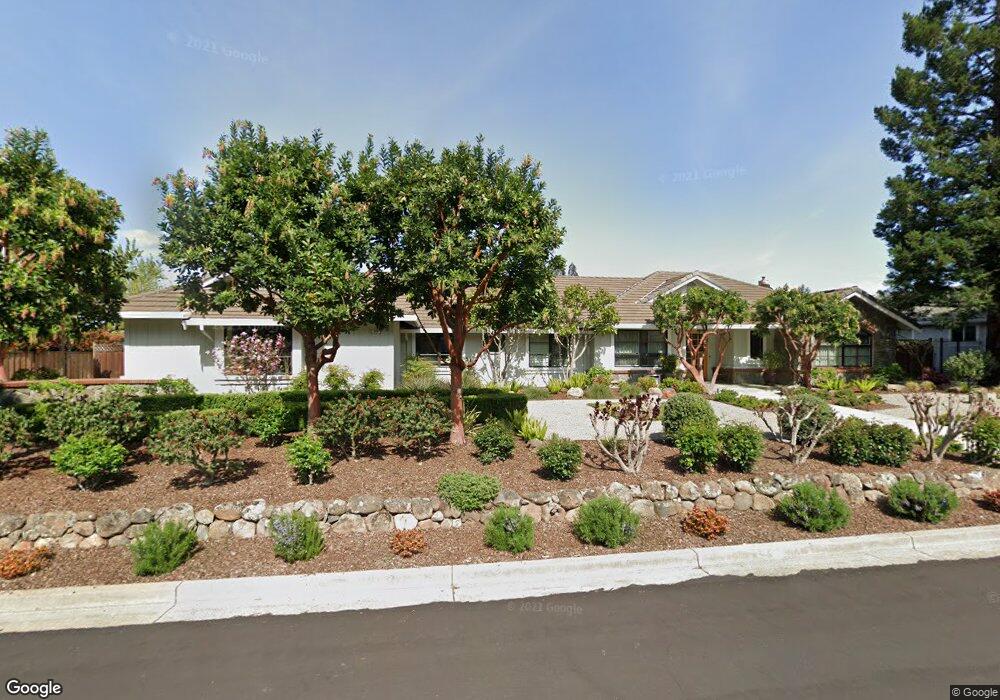
234 Tiburon Ct Walnut Creek, CA 94597
Estimated Value: $1,908,724 - $2,213,000
4
Beds
4
Baths
3,216
Sq Ft
$650/Sq Ft
Est. Value
About This Home
This home is located at 234 Tiburon Ct, Walnut Creek, CA 94597 and is currently estimated at $2,089,681, approximately $649 per square foot. 234 Tiburon Ct is a home located in Contra Costa County with nearby schools including Buena Vista Elementary School, Walnut Creek Intermediate School, and Las Lomas High School.
Ownership History
Date
Name
Owned For
Owner Type
Purchase Details
Closed on
Nov 23, 2013
Sold by
Tam Tommy S and Tam Dorcas S
Bought by
Tam Tommy S and Tam Dorcas S
Current Estimated Value
Create a Home Valuation Report for This Property
The Home Valuation Report is an in-depth analysis detailing your home's value as well as a comparison with similar homes in the area
Home Values in the Area
Average Home Value in this Area
Purchase History
| Date | Buyer | Sale Price | Title Company |
|---|---|---|---|
| Tam Tommy S | -- | None Available |
Source: Public Records
Tax History Compared to Growth
Tax History
| Year | Tax Paid | Tax Assessment Tax Assessment Total Assessment is a certain percentage of the fair market value that is determined by local assessors to be the total taxable value of land and additions on the property. | Land | Improvement |
|---|---|---|---|---|
| 2025 | $7,656 | $641,840 | $152,318 | $489,522 |
| 2024 | $7,464 | $629,256 | $149,332 | $479,924 |
| 2023 | $7,464 | $616,918 | $146,404 | $470,514 |
| 2022 | $7,299 | $604,823 | $143,534 | $461,289 |
| 2021 | $7,091 | $592,965 | $140,720 | $452,245 |
| 2019 | $6,922 | $575,380 | $136,548 | $438,832 |
| 2018 | $6,676 | $564,099 | $133,871 | $430,228 |
| 2017 | $6,539 | $553,040 | $131,247 | $421,793 |
| 2016 | $6,784 | $542,197 | $128,674 | $413,523 |
| 2015 | $6,626 | $534,054 | $126,742 | $407,312 |
| 2014 | $6,541 | $523,594 | $124,260 | $399,334 |
Source: Public Records
Map
Nearby Homes
- 152 Rosemont Ct
- 131 Montecito Crescent
- 1600 Springbrook Rd
- 125 Montanya Ct
- 1475 Quail View Cir
- 40 Rodrigues Ln
- 955 Camino Verde Cir
- 1160 Dunsyre Dr
- 1378 Cornwall Ct
- 194 Hillcroft Way
- 325 Beacon Ridge Ln
- 130 Hillcroft Way
- 314 Beacon Ridge Ln
- 121 School Ln
- 2465 Buena Vista Ave
- 2527 Buena Vista Ave
- 2162 Hillside Ave
- 645 Keith Ct
- 1630 Terrace Way
- 122 Vista Hermosa