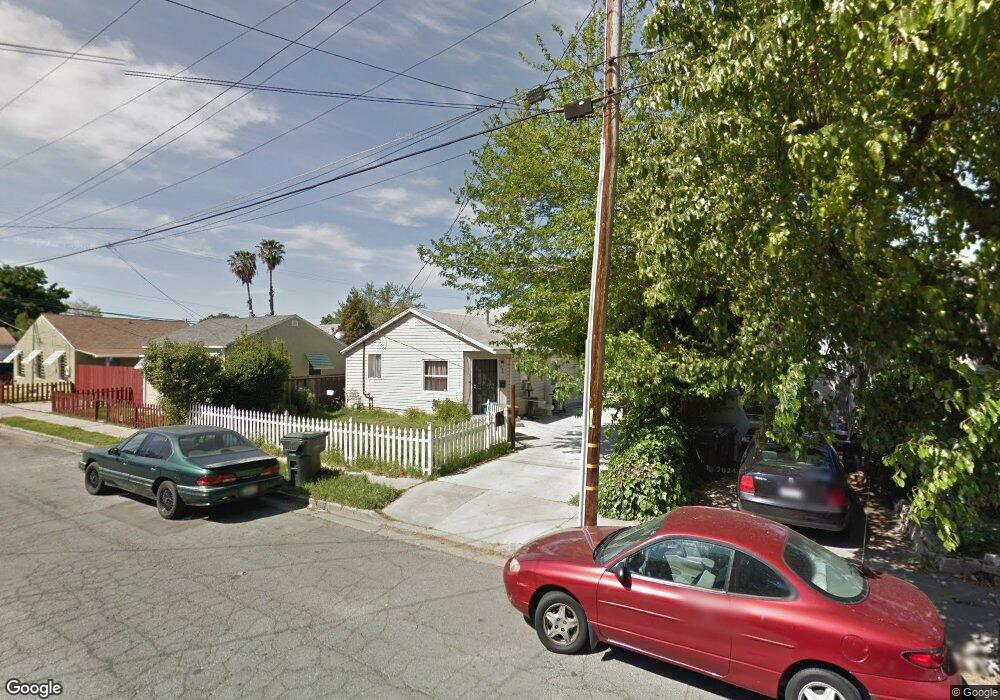
234 W Madill St Antioch, CA 94509
North Antioch NeighborhoodEstimated Value: $412,000 - $482,000
3
Beds
1
Bath
1,209
Sq Ft
$383/Sq Ft
Est. Value
About This Home
This home is located at 234 W Madill St, Antioch, CA 94509 and is currently estimated at $463,095, approximately $383 per square foot. 234 W Madill St is a home located in Contra Costa County with nearby schools including Marsh Elementary School, Antioch Middle School, and Antioch High School.
Ownership History
Date
Name
Owned For
Owner Type
Purchase Details
Closed on
Feb 17, 2022
Sold by
Arana and Ruth
Bought by
Ss Realty Llc
Current Estimated Value
Home Financials for this Owner
Home Financials are based on the most recent Mortgage that was taken out on this home.
Original Mortgage
$315,300
Outstanding Balance
$292,780
Interest Rate
3.55%
Mortgage Type
New Conventional
Estimated Equity
$170,315
Purchase Details
Closed on
Jun 16, 2011
Sold by
White Martha R
Bought by
Arana Alberto and Arana Ruth
Create a Home Valuation Report for This Property
The Home Valuation Report is an in-depth analysis detailing your home's value as well as a comparison with similar homes in the area
Home Values in the Area
Average Home Value in this Area
Purchase History
| Date | Buyer | Sale Price | Title Company |
|---|---|---|---|
| Ss Realty Llc | $317,000 | Usa National Title | |
| Arana Alberto | $79,000 | Old Republic Title Company |
Source: Public Records
Mortgage History
| Date | Status | Borrower | Loan Amount |
|---|---|---|---|
| Open | Ss Realty Llc | $315,300 |
Source: Public Records
Tax History Compared to Growth
Tax History
| Year | Tax Paid | Tax Assessment Tax Assessment Total Assessment is a certain percentage of the fair market value that is determined by local assessors to be the total taxable value of land and additions on the property. | Land | Improvement |
|---|---|---|---|---|
| 2025 | $5,603 | $461,625 | $318,362 | $143,263 |
| 2024 | $5,460 | $452,574 | $312,120 | $140,454 |
| 2023 | $5,460 | $443,700 | $306,000 | $137,700 |
| 2022 | $1,574 | $95,003 | $72,433 | $22,570 |
| 2021 | $1,513 | $93,141 | $71,013 | $22,128 |
| 2019 | $1,471 | $90,380 | $68,907 | $21,473 |
| 2018 | $1,419 | $88,608 | $67,556 | $21,052 |
| 2017 | $1,376 | $86,872 | $66,232 | $20,640 |
| 2016 | $1,329 | $85,170 | $64,934 | $20,236 |
| 2015 | $1,305 | $83,892 | $63,959 | $19,933 |
| 2014 | $1,261 | $82,250 | $62,707 | $19,543 |
Source: Public Records
Map
Nearby Homes