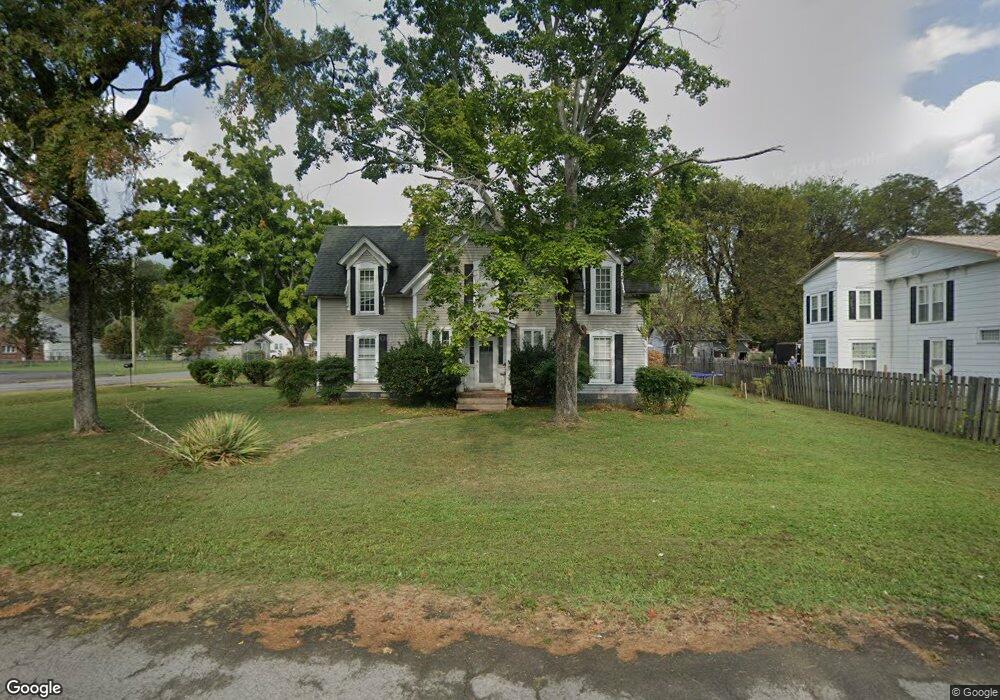
234 W Rhea Ave Unit Church St Spring City, TN 37381
Estimated Value: $221,000 - $279,000
4
Beds
2
Baths
2,005
Sq Ft
$127/Sq Ft
Est. Value
About This Home
This home is located at 234 W Rhea Ave Unit Church St, Spring City, TN 37381 and is currently estimated at $255,214, approximately $127 per square foot. 234 W Rhea Ave Unit Church St is a home located in Rhea County with nearby schools including Rhea County High School, King Memorial Seventh Day Adve, and Spring City Christian Academy.
Ownership History
Date
Name
Owned For
Owner Type
Purchase Details
Closed on
Mar 17, 2015
Sold by
Cortez Investments Grp Inc
Bought by
Davenport Judy
Current Estimated Value
Home Financials for this Owner
Home Financials are based on the most recent Mortgage that was taken out on this home.
Original Mortgage
$98,090
Outstanding Balance
$77,072
Interest Rate
4.4%
Mortgage Type
FHA
Estimated Equity
$178,142
Purchase Details
Closed on
Jan 8, 2007
Bought by
Cortez Investments Group Inc
Purchase Details
Closed on
May 9, 2000
Sold by
Dean Vera S
Bought by
Garrison Nale Maureen E
Purchase Details
Closed on
Dec 31, 1990
Bought by
Dean Vera S and Garrison Maureen E
Purchase Details
Closed on
Feb 26, 1988
Bought by
Dean Robert D and Dean Vera
Purchase Details
Closed on
Apr 22, 1985
Bought by
Gibson Bess Heirs
Purchase Details
Closed on
Jan 1, 1981
Purchase Details
Closed on
Jan 21, 1946
Bought by
Gibson R B Bess
Create a Home Valuation Report for This Property
The Home Valuation Report is an in-depth analysis detailing your home's value as well as a comparison with similar homes in the area
Home Values in the Area
Average Home Value in this Area
Purchase History
| Date | Buyer | Sale Price | Title Company |
|---|---|---|---|
| Davenport Judy | $99,900 | -- | |
| Cortez Investments Group Inc | $45,000 | -- | |
| Garrison Nale Maureen E | -- | -- | |
| Dean Vera S | -- | -- | |
| Dean Robert D | $35,000 | -- | |
| Gibson Bess Heirs | -- | -- | |
| -- | $15,000 | -- | |
| Gibson R B Bess | -- | -- |
Source: Public Records
Mortgage History
| Date | Status | Borrower | Loan Amount |
|---|---|---|---|
| Open | Davenport Judy | $98,090 |
Source: Public Records
Tax History Compared to Growth
Tax History
| Year | Tax Paid | Tax Assessment Tax Assessment Total Assessment is a certain percentage of the fair market value that is determined by local assessors to be the total taxable value of land and additions on the property. | Land | Improvement |
|---|---|---|---|---|
| 2024 | -- | $49,025 | $4,525 | $44,500 |
| 2023 | $1,020 | $26,675 | $2,425 | $24,250 |
| 2022 | $966 | $25,575 | $2,425 | $23,150 |
| 2021 | $948 | $25,575 | $2,425 | $23,150 |
| 2020 | $861 | $25,575 | $2,425 | $23,150 |
| 2019 | $861 | $25,575 | $2,425 | $23,150 |
| 2018 | $843 | $25,500 | $4,950 | $20,550 |
| 2017 | $805 | $25,500 | $4,950 | $20,550 |
| 2016 | $805 | $25,500 | $4,950 | $20,550 |
| 2015 | $780 | $25,500 | $4,950 | $20,550 |
| 2014 | $505 | $24,100 | $3,600 | $20,500 |
| 2013 | -- | $24,100 | $3,600 | $20,500 |
Source: Public Records
Map
Nearby Homes
- 0 Bayshore Dr Unit SPRING CITY TN 37381
- 491 Piccadilly Ave
- 107 E Jackson Ave
- 107 &149 E Jackson Ave
- 498 W Rhea Ave
- 174 E Jackson Ave
- 229 Pierce St
- 676 W Rhea Ave
- 277 Cemetery Rd
- 393 Pocahontas Ave
- 0 Beach Rd Unit RTC2986615
- 0 Beach Rd Unit 1508308
- 229 Pierce Hill Rd
- 229 Pierce Hill St
- Lot 33 Hinch St
- Lot 32 Hinch St
- 000 Wassom Memorial Hwy
- 281 Ketchersid Ave
- Lot351-354 Diana Dr
- Lot 351 Diana Dr
- 234 W Rhea Ave
- 246 W Rhea Ave
- 935 Kings Hill Rd Unit 71
- 935 Kings Hill Rd Unit 69-72
- 935 Kings Hill Rd
- 260 W Rhea Ave
- 198 W Rhea Ave
- 245 W Rhea Ave
- 261 W Rhea Ave
- 150 W Rhea Ave
- 189 W Rhea Ave Unit John's Place Restaur
- 189 W Rhea Ave
- 271 W Jackson Ave
- 291 W Jackson Ave
- 288 W Rhea Ave
- 288 W Rhea Ave Unit 288 West Rhea
- 288 W Rhea Ave Unit 288 West Rhea Ave
- 244 Church St
- 279 W Rhea Ave
- 325 W Jackson Ave