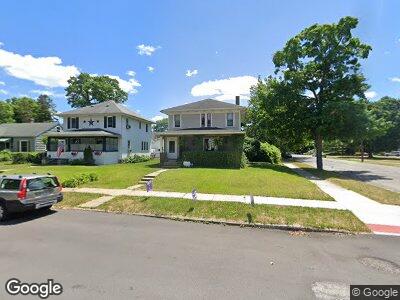
234 Wakewa Ave South Bend, IN 46617
North Shore Triangle NeighborhoodEstimated Value: $206,694 - $277,000
3
Beds
1
Bath
1,456
Sq Ft
$165/Sq Ft
Est. Value
About This Home
This home is located at 234 Wakewa Ave, South Bend, IN 46617 and is currently estimated at $240,174, approximately $164 per square foot. 234 Wakewa Ave is a home located in St. Joseph County with nearby schools including Muessel Primary Center, Edison Middle School, and Clay High School.
Ownership History
Date
Name
Owned For
Owner Type
Purchase Details
Closed on
Dec 3, 2019
Sold by
Ivacic Jerome P
Bought by
Benedict Xvi Llc
Current Estimated Value
Purchase Details
Closed on
Mar 15, 2012
Sold by
Teachers Cu
Bought by
Ivacic Jerome P
Home Financials for this Owner
Home Financials are based on the most recent Mortgage that was taken out on this home.
Original Mortgage
$50,000
Interest Rate
3.95%
Mortgage Type
New Conventional
Purchase Details
Closed on
Oct 7, 2011
Sold by
Classic Rehabs Llp
Bought by
Teachers Credit Union
Purchase Details
Closed on
Nov 30, 2007
Sold by
Griffith Jack
Bought by
Classic Rehabs Llp
Home Financials for this Owner
Home Financials are based on the most recent Mortgage that was taken out on this home.
Original Mortgage
$137,000
Interest Rate
6.33%
Mortgage Type
Future Advance Clause Open End Mortgage
Purchase Details
Closed on
Jul 19, 2007
Sold by
Dreher Stova
Bought by
Morequity Inc
Purchase Details
Closed on
Jun 20, 2005
Sold by
Dreher Melinda R
Bought by
Dreher Stova
Create a Home Valuation Report for This Property
The Home Valuation Report is an in-depth analysis detailing your home's value as well as a comparison with similar homes in the area
Home Values in the Area
Average Home Value in this Area
Purchase History
| Date | Buyer | Sale Price | Title Company |
|---|---|---|---|
| Benedict Xvi Llc | -- | None Available | |
| Ivacic Jerome P | -- | Metropolitan Title | |
| Teachers Credit Union | -- | None Available | |
| Classic Rehabs Llp | -- | Meridian Title | |
| Morequity Inc | $88,000 | None Available | |
| Dreher Stova | -- | Progressive Land Title |
Source: Public Records
Mortgage History
| Date | Status | Borrower | Loan Amount |
|---|---|---|---|
| Previous Owner | Ivacic Jerome P | $50,000 | |
| Previous Owner | Classic Rehabs Llp | $137,000 |
Source: Public Records
Tax History Compared to Growth
Tax History
| Year | Tax Paid | Tax Assessment Tax Assessment Total Assessment is a certain percentage of the fair market value that is determined by local assessors to be the total taxable value of land and additions on the property. | Land | Improvement |
|---|---|---|---|---|
| 2024 | $2,003 | $101,000 | $16,400 | $84,600 |
| 2023 | $1,987 | $82,200 | $16,400 | $65,800 |
| 2022 | $1,987 | $89,000 | $16,400 | $72,600 |
| 2021 | $1,944 | $79,200 | $13,000 | $66,200 |
| 2020 | $1,944 | $79,200 | $13,000 | $66,200 |
| 2019 | $1,833 | $89,500 | $13,000 | $76,500 |
| 2018 | $1,256 | $50,800 | $13,000 | $37,800 |
| 2017 | $1,304 | $50,600 | $13,000 | $37,600 |
| 2016 | $1,332 | $50,600 | $13,000 | $37,600 |
| 2014 | $1,304 | $49,900 | $13,000 | $36,900 |
Source: Public Records
Map
Nearby Homes
- 209 Marquette Ave
- 134 Wakewa Ave
- 214 Tonti St
- 212 Marquette Ave
- 208 Tonti St
- 405 Parkovash Ave
- 113 W North Shore Dr
- 1230 Hillcrest Rd
- 1026 N Michigan St
- 1208 Leeper Ave
- 122 E North Shore Dr
- 836 Dushane Ct
- 1025 Riverside Dr
- 615 Marquette Ave
- 627 Ostemo Place
- 1009 N Niles Ave
- 817 Leland Ave
- 602 W Angela Blvd
- 1069 Riverside Dr
- 1110 Foster St
- 234 Wakewa Ave
- 230 Wakewa Ave
- 226 Wakewa Ave
- 1102 N Lafayette Blvd
- 229 Marquette Ave
- 224 Wakewa Ave
- 225 Marquette Ave
- 221 Marquette Ave
- 220 Wakewa Ave
- 1128 N Lafayette Blvd
- 229 Wakewa Ave
- 215 Marquette Ave
- 227 Wakewa Ave
- 216 Wakewa Ave
- 305 Wakewa Ave
- 217 Wakewa Ave
- 210 Wakewa Ave
- 205 Marquette Ave
- 309 Wakewa Ave
- 232 Marquette Ave