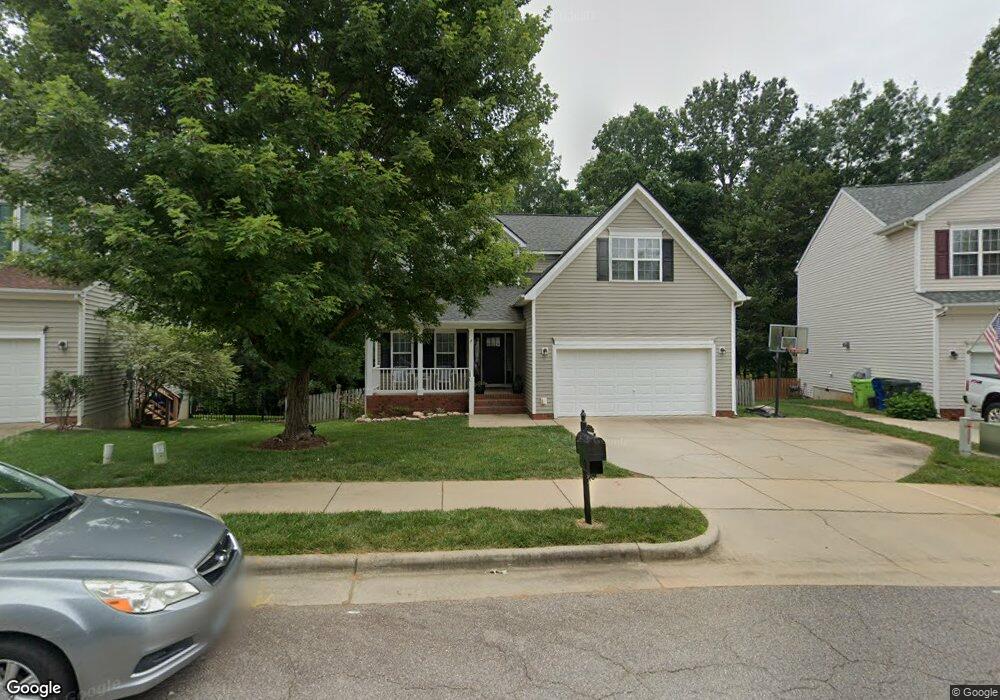
2340 Spruce Shadows Ln Raleigh, NC 27614
Falls Lake NeighborhoodEstimated Value: $452,000 - $512,000
4
Beds
3
Baths
2,281
Sq Ft
$206/Sq Ft
Est. Value
About This Home
This home is located at 2340 Spruce Shadows Ln, Raleigh, NC 27614 and is currently estimated at $469,506, approximately $205 per square foot. 2340 Spruce Shadows Ln is a home located in Wake County with nearby schools including Wakefield Elementary School, Wakefield Middle, and Wakefield High School.
Ownership History
Date
Name
Owned For
Owner Type
Purchase Details
Closed on
Mar 19, 2012
Sold by
Roberson Tanya Mccarty and Roberson William Eric
Bought by
Long Mitchell S and Long Christie I
Current Estimated Value
Home Financials for this Owner
Home Financials are based on the most recent Mortgage that was taken out on this home.
Original Mortgage
$222,220
Outstanding Balance
$151,773
Interest Rate
3.75%
Mortgage Type
FHA
Estimated Equity
$317,733
Purchase Details
Closed on
Sep 3, 2008
Sold by
Roberson Tanya Mccarty and Hill Tanya Mccarty
Bought by
Roberson Tanya Mccarty and Roberson William Eric
Purchase Details
Closed on
Mar 12, 2003
Sold by
Don Galloway Homes Llc
Bought by
Hill Jason Bruce and Hill Tanya Mccarty
Home Financials for this Owner
Home Financials are based on the most recent Mortgage that was taken out on this home.
Original Mortgage
$166,660
Interest Rate
5.82%
Create a Home Valuation Report for This Property
The Home Valuation Report is an in-depth analysis detailing your home's value as well as a comparison with similar homes in the area
Home Values in the Area
Average Home Value in this Area
Purchase History
| Date | Buyer | Sale Price | Title Company |
|---|---|---|---|
| Long Mitchell S | $228,000 | None Available | |
| Roberson Tanya Mccarty | -- | None Available | |
| Hill Jason Bruce | $208,500 | -- |
Source: Public Records
Mortgage History
| Date | Status | Borrower | Loan Amount |
|---|---|---|---|
| Open | Long Mitchell S | $222,220 | |
| Previous Owner | Hill Jason Bruce | $166,660 | |
| Closed | Hill Jason Bruce | $20,832 |
Source: Public Records
Tax History Compared to Growth
Tax History
| Year | Tax Paid | Tax Assessment Tax Assessment Total Assessment is a certain percentage of the fair market value that is determined by local assessors to be the total taxable value of land and additions on the property. | Land | Improvement |
|---|---|---|---|---|
| 2025 | $3,950 | $450,629 | $120,000 | $330,629 |
| 2024 | $3,934 | $450,629 | $120,000 | $330,629 |
| 2023 | $3,188 | $290,597 | $53,000 | $237,597 |
| 2022 | $2,962 | $290,597 | $53,000 | $237,597 |
| 2021 | $2,848 | $290,597 | $53,000 | $237,597 |
| 2020 | $2,796 | $290,597 | $53,000 | $237,597 |
| 2019 | $2,799 | $239,784 | $40,000 | $199,784 |
| 2018 | $2,640 | $239,784 | $40,000 | $199,784 |
| 2017 | $2,514 | $239,784 | $40,000 | $199,784 |
| 2016 | $2,463 | $239,784 | $40,000 | $199,784 |
| 2015 | $2,651 | $254,076 | $55,000 | $199,076 |
| 2014 | $2,515 | $254,076 | $55,000 | $199,076 |
Source: Public Records
Map
Nearby Homes
- 2536 Bent Green St
- 2220 Spruce Shadows Ln
- 2561 Bent Green St
- 2545 Forest Shadows Ln
- 2822 Winter Song Rd
- 2738 Garden Knoll Ln
- 2116 Covered Bridge Ct
- 13201 Townfield Dr
- 2704 Snowy Meadow Ct
- 10701 Royal Forrest Dr
- 3428 van Hessen Dr
- 3436 Falls River Ave
- 2728 Cloud Mist Cir
- 3220 Queensland Rd
- 3328 Queensland Rd
- 2740 Cloud Mist Cir
- 2419 Rogerson St
- 2420 Rogerson St
- 2201 Wide River Dr
- 3821 Falls River Ave
- 2344 Spruce Shadows Ln
- 2336 Spruce Shadows Ln
- 2348 Spruce Shadows Ln
- 2332 Spruce Shadows Ln
- 2337 Spruce Shadows Ln
- 2330 Spruce Shadows Ln
- 2345 Spruce Shadows Ln
- 2352 Spruce Shadows Ln
- 2328 Spruce Shadows Ln
- 2327 Spruce Shadows Ln
- 2351 Spruce Shadows Ln
- 2324 Spruce Shadows Ln
- 2356 Spruce Shadows Ln
- 2355 Spruce Shadows Ln
- 2319 Spruce Shadows Ln
- 2408 Stately Oaks Dr
- 2513 Bent Green St
- 2509 Bent Green St
- 2412 Stately Oaks Dr
- 2404 Stately Oaks Dr