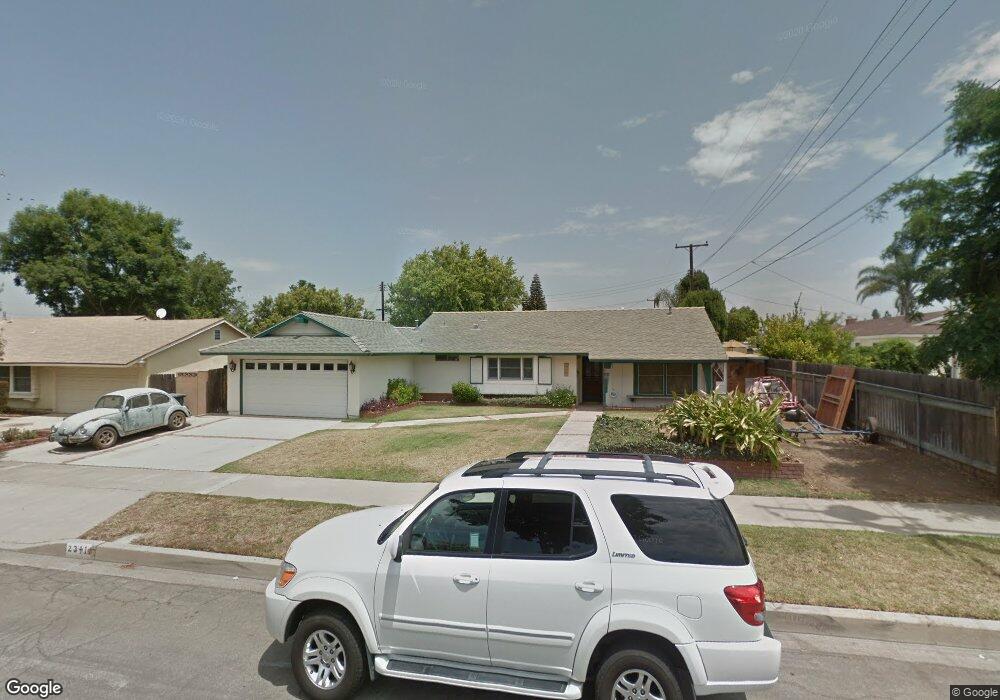
2341 E Sycamore Ave Orange, CA 92867
Estimated Value: $978,000 - $1,145,000
3
Beds
2
Baths
1,259
Sq Ft
$823/Sq Ft
Est. Value
About This Home
This home is located at 2341 E Sycamore Ave, Orange, CA 92867 and is currently estimated at $1,036,737, approximately $823 per square foot. 2341 E Sycamore Ave is a home located in Orange County with nearby schools including Handy Elementary School, Yorba Middle School, and Orange High School.
Ownership History
Date
Name
Owned For
Owner Type
Purchase Details
Closed on
Jun 27, 2011
Sold by
Lee Trudy
Bought by
Rodriguez Consuelo Ventura and Rodriguez Anthony Edward
Current Estimated Value
Home Financials for this Owner
Home Financials are based on the most recent Mortgage that was taken out on this home.
Original Mortgage
$375,240
Interest Rate
4.46%
Mortgage Type
FHA
Purchase Details
Closed on
Nov 22, 2003
Sold by
Lee James D and Lee Trudy
Bought by
Lee James D and Lee Trudy
Create a Home Valuation Report for This Property
The Home Valuation Report is an in-depth analysis detailing your home's value as well as a comparison with similar homes in the area
Home Values in the Area
Average Home Value in this Area
Purchase History
| Date | Buyer | Sale Price | Title Company |
|---|---|---|---|
| Rodriguez Consuelo Ventura | $385,000 | Stewart Title Company | |
| Lee James D | -- | -- |
Source: Public Records
Mortgage History
| Date | Status | Borrower | Loan Amount |
|---|---|---|---|
| Previous Owner | Rodriguez Consuelo Ventura | $375,240 |
Source: Public Records
Tax History
| Year | Tax Paid | Tax Assessment Tax Assessment Total Assessment is a certain percentage of the fair market value that is determined by local assessors to be the total taxable value of land and additions on the property. | Land | Improvement |
|---|---|---|---|---|
| 2025 | $5,405 | $483,575 | $389,061 | $94,514 |
| 2024 | $5,405 | $474,094 | $381,433 | $92,661 |
| 2023 | $5,284 | $464,799 | $373,954 | $90,845 |
| 2022 | $5,181 | $455,686 | $366,622 | $89,064 |
| 2021 | $5,038 | $446,751 | $359,433 | $87,318 |
| 2020 | $4,992 | $442,171 | $355,748 | $86,423 |
| 2019 | $4,930 | $433,501 | $348,772 | $84,729 |
| 2018 | $4,856 | $425,001 | $341,933 | $83,068 |
| 2017 | $4,657 | $416,668 | $335,228 | $81,440 |
| 2016 | $4,568 | $408,499 | $328,655 | $79,844 |
| 2015 | $4,501 | $402,363 | $323,718 | $78,645 |
| 2014 | $4,405 | $394,482 | $317,377 | $77,105 |
Source: Public Records
Map
Nearby Homes
- 195 N Malena Dr
- 677 N Clinton St
- 2929 E Hamilton Ave
- 1514 E Palm Ave
- 3139 E Chapman Ave Unit 3B
- 773 N Elmwood St
- 2201 E Oakmont Ave
- 692 N Adele St Unit 50
- 692 N Adele St Unit 30
- 692 N Adele St
- 692 N Adele St Unit 78
- 448 N Londonderry Ln Unit D
- 369 S Jennifer Ln
- 244 S Violet Ln
- 365 N Magnolia St
- 1342 E Chapman Ave
- 3527 E Barrington Dr
- 1344 E Mayfair Ave
- 3410 E Lambeth Ct Unit F
- 1801 E Collins Ave Unit 36
- 2327 E Sycamore Ave
- 350 N Clinton St
- 375 N Milford Rd
- 362 N Clinton St
- 371 N Milford Rd
- 374 N Clinton St
- 2342 E Sycamore Ave
- 328 N Clinton St
- 2328 E Sycamore Ave
- 379 N Milford Rd
- 384 N Clinton St
- 360 N Milford Rd
- 318 N Clinton St
- 349 N Clinton St
- 363 N Clinton St
- 340 N Milford Rd
- 370 N Milford Rd
- 2341 E Palm Ave
- 394 N Clinton St
- 385 N Milford Rd
Your Personal Tour Guide
Ask me questions while you tour the home.