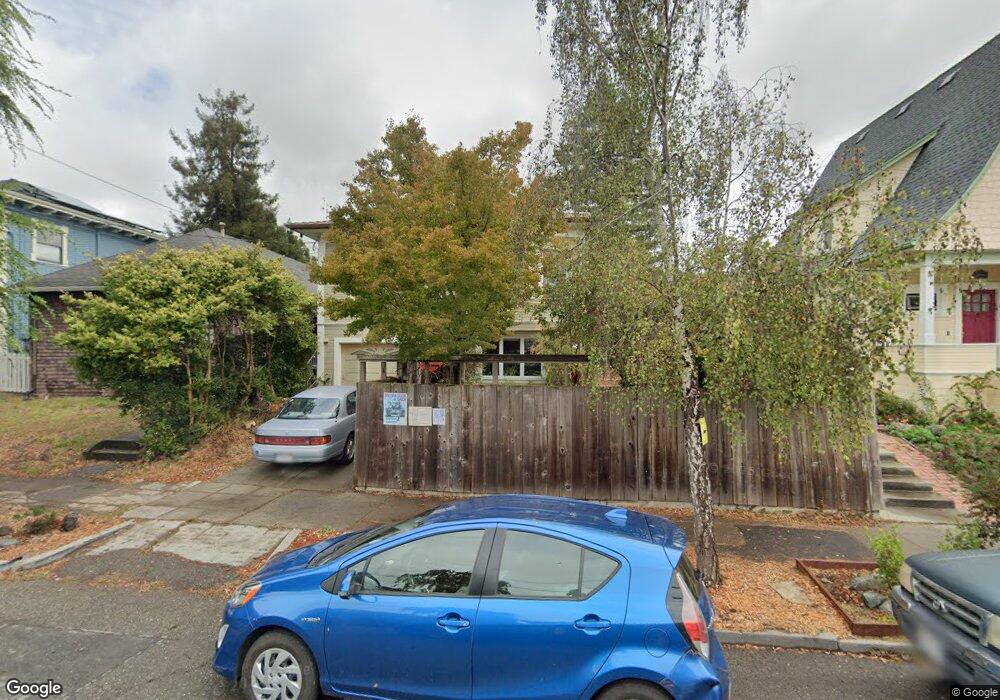
2341 Roosevelt Ave Unit 2 Berkeley, CA 94703
Downtown Berkeley NeighborhoodEstimated Value: $694,668 - $763,000
3
Beds
1
Bath
840
Sq Ft
$856/Sq Ft
Est. Value
About This Home
This home is located at 2341 Roosevelt Ave Unit 2, Berkeley, CA 94703 and is currently estimated at $718,667, approximately $855 per square foot. 2341 Roosevelt Ave Unit 2 is a home located in Alameda County with nearby schools including Washington Elementary School, Berkeley Arts Magnet at Whittier School, and Oxford Elementary School.
Ownership History
Date
Name
Owned For
Owner Type
Purchase Details
Closed on
Jun 26, 2009
Sold by
Johnston Hilda C
Bought by
Johnston Hilda C
Current Estimated Value
Purchase Details
Closed on
Jul 20, 1994
Sold by
Herren Alan and Metcalf Anastacia
Bought by
Track Richard and Johnston Hilda
Home Financials for this Owner
Home Financials are based on the most recent Mortgage that was taken out on this home.
Original Mortgage
$39,000
Interest Rate
4.25%
Create a Home Valuation Report for This Property
The Home Valuation Report is an in-depth analysis detailing your home's value as well as a comparison with similar homes in the area
Home Values in the Area
Average Home Value in this Area
Purchase History
| Date | Buyer | Sale Price | Title Company |
|---|---|---|---|
| Johnston Hilda C | -- | None Available | |
| Track Richard S | -- | None Available | |
| Track Richard | -- | Northwestern Title Company |
Source: Public Records
Mortgage History
| Date | Status | Borrower | Loan Amount |
|---|---|---|---|
| Closed | Track Richard | $39,000 |
Source: Public Records
Tax History
| Year | Tax Paid | Tax Assessment Tax Assessment Total Assessment is a certain percentage of the fair market value that is determined by local assessors to be the total taxable value of land and additions on the property. | Land | Improvement |
|---|---|---|---|---|
| 2025 | $3,787 | $124,188 | $39,312 | $91,876 |
| 2024 | $3,787 | $121,617 | $38,542 | $90,075 |
| 2023 | $3,687 | $126,095 | $37,786 | $88,309 |
| 2022 | $3,576 | $116,623 | $37,045 | $86,578 |
| 2021 | $3,553 | $114,199 | $36,319 | $84,880 |
| 2020 | $3,266 | $119,957 | $35,947 | $84,010 |
| 2019 | $3,030 | $117,605 | $35,242 | $82,363 |
| 2018 | $2,952 | $115,299 | $34,551 | $80,748 |
| 2017 | $2,824 | $113,039 | $33,874 | $79,165 |
| 2016 | $2,654 | $110,823 | $33,210 | $77,613 |
| 2015 | $2,607 | $109,158 | $32,711 | $76,447 |
| 2014 | $2,559 | $107,020 | $32,070 | $74,950 |
Source: Public Records
Map
Nearby Homes
- 1604 Dwight Way
- 1634 Blake St
- 2350 Sacramento St
- 1612 Parker St
- 1524 Blake St
- 2218 -2222 Grant St
- 1901 Parker St Unit 3
- 1819 Carleton St
- 2118 California St
- 2304 Edwards St
- 2437 Acton St
- 2701 Grant St
- 1515 Derby St
- 2750 Sacramento St
- 1450 Ward St
- 2758 Sacramento St
- 2774 Sacramento St
- 1512 Hearst Ave Unit 1512
- 2782 Sacramento St
- 2790 Sacramento St
- 2341 Roosevelt Ave
- 2341 Roosevelt Ave Unit 1
- 2335 Roosevelt Ave
- 2343 Roosevelt Ave
- 2331 Roosevelt Ave
- 1729 Channing Way
- 2329 Roosevelt Ave
- 1731 Channing Way
- 1727 Channing Way
- 1733 Channing Way
- 2325 Roosevelt Ave
- 2340 Roosevelt Ave
- 1735 Channing Way
- 2334 Roosevelt Ave
- 2338 Roosevelt Ave
- 1719 Channing Way
- 2334 Grant St
- 2330 Roosevelt Ave
- 2319 Roosevelt Ave
- 2332 Grant St
Your Personal Tour Guide
Ask me questions while you tour the home.