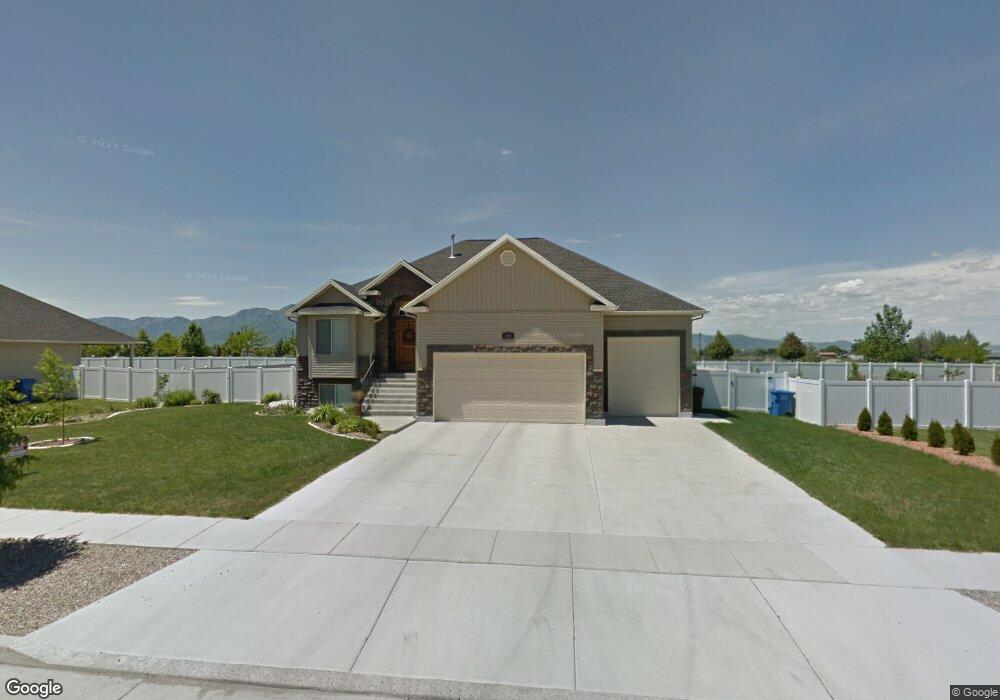
2341 S 770 W Unit 71 Nibley, UT 84321
Estimated Value: $474,000 - $564,000
--
Bed
--
Bath
1,276
Sq Ft
$411/Sq Ft
Est. Value
About This Home
This home is located at 2341 S 770 W Unit 71, Nibley, UT 84321 and is currently estimated at $524,011, approximately $410 per square foot. 2341 S 770 W Unit 71 is a home located in Cache County with nearby schools including Nibley School, Spring Creek Middle School, and South Cache Middle School.
Ownership History
Date
Name
Owned For
Owner Type
Purchase Details
Closed on
Sep 18, 2013
Sold by
Robinson Clinton R and Robinson Rachel E
Bought by
Atkinson Eric D
Current Estimated Value
Home Financials for this Owner
Home Financials are based on the most recent Mortgage that was taken out on this home.
Original Mortgage
$237,650
Outstanding Balance
$176,520
Interest Rate
4.36%
Mortgage Type
New Conventional
Estimated Equity
$347,491
Purchase Details
Closed on
Aug 3, 2010
Sold by
Robinson Clint R and Robinson Rachel E
Bought by
Robinson Clinton R and Robinson Rachel E
Home Financials for this Owner
Home Financials are based on the most recent Mortgage that was taken out on this home.
Original Mortgage
$186,600
Interest Rate
4.65%
Mortgage Type
New Conventional
Purchase Details
Closed on
Feb 28, 2008
Sold by
Aspen Homes Development Inc
Bought by
Robinson Clint R and Robinson Rachel E
Home Financials for this Owner
Home Financials are based on the most recent Mortgage that was taken out on this home.
Original Mortgage
$172,000
Interest Rate
5.64%
Mortgage Type
Construction
Create a Home Valuation Report for This Property
The Home Valuation Report is an in-depth analysis detailing your home's value as well as a comparison with similar homes in the area
Home Values in the Area
Average Home Value in this Area
Purchase History
| Date | Buyer | Sale Price | Title Company |
|---|---|---|---|
| Atkinson Eric D | -- | Hickman Land Title Company | |
| Robinson Clinton R | -- | Hickman Land Title Company | |
| Robinson Clint R | -- | Mountain View Title |
Source: Public Records
Mortgage History
| Date | Status | Borrower | Loan Amount |
|---|---|---|---|
| Open | Atkinson Eric D | $237,650 | |
| Previous Owner | Robinson Clinton R | $186,600 | |
| Previous Owner | Robinson Clint R | $172,000 |
Source: Public Records
Tax History Compared to Growth
Tax History
| Year | Tax Paid | Tax Assessment Tax Assessment Total Assessment is a certain percentage of the fair market value that is determined by local assessors to be the total taxable value of land and additions on the property. | Land | Improvement |
|---|---|---|---|---|
| 2025 | $2,392 | $317,095 | $0 | $0 |
| 2024 | $2,531 | $314,990 | $0 | $0 |
| 2023 | $2,621 | $305,415 | $0 | $0 |
| 2022 | $2,728 | $305,415 | $0 | $0 |
| 2021 | $1,952 | $339,401 | $65,000 | $274,401 |
| 2020 | $1,834 | $303,610 | $65,000 | $238,610 |
| 2019 | $1,924 | $303,610 | $65,000 | $238,610 |
| 2018 | $1,653 | $254,545 | $41,500 | $213,045 |
| 2017 | $1,648 | $134,420 | $0 | $0 |
| 2016 | $1,666 | $103,185 | $0 | $0 |
| 2015 | $1,271 | $103,185 | $0 | $0 |
| 2014 | $1,242 | $103,185 | $0 | $0 |
| 2013 | -- | $103,185 | $0 | $0 |
Source: Public Records
Map
Nearby Homes
- 2269 Clear Creek Rd
- 2313 S 1000 W Unit 110
- 2313 S 1000 W
- 1045 W 2400 S
- 2301 S 1050 W
- 2301 S 1050 W Unit 99
- 2271 S 1050 W
- 2271 S 1050 W Unit 96
- 2616 S 900 W
- 3308 S 1000 W
- 3318 S 1000 W
- 2615 S 600 W
- 2206 S 1120 W Unit 65
- 2206 S 1120 W
- 1140 2260 S
- Alpine Plan at Firefly Estates - Single Family
- Monroe Plan at Firefly Estates - Single Family
- Gala Plan at Firefly Estates - Single Family
- Phoenix Plan at Firefly Estates - Single Family
- Briarwood Plan at Firefly Estates - Single Family
- 2341 S 770 W
- 2327 S 770 W
- 2353 S 770 W
- 2334 S 770 W
- 2365 S 770 W
- 2313 S 770 W
- 2348 S 770 W
- 2320 S 770 W Unit 57
- 2320 S 770 W
- 2364 770 W
- 2306 S 770 W
- 2327 Clear Creek Cir
- 2297 S 770 W
- 2347 Clear Creek Dr
- 741 Clear Creek Rd
- 786 2380 S
- 754 W 2280 S
- 786 Clear Creek Rd Unit 1
- 786 Clear Creek Rd
- 768 Clear Creek Rd Unit 2