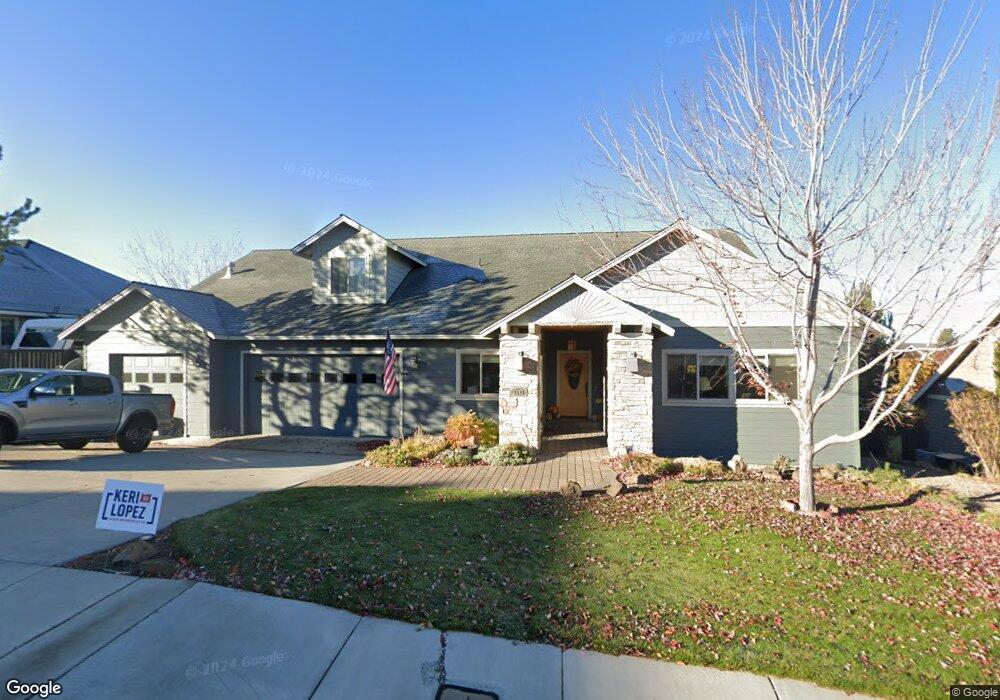
2341 SW 43rd St Unit Lot 8 Redmond, OR 97756
Estimated Value: $757,924 - $799,000
4
Beds
4
Baths
3,030
Sq Ft
$259/Sq Ft
Est. Value
About This Home
This home is located at 2341 SW 43rd St Unit Lot 8, Redmond, OR 97756 and is currently estimated at $784,731, approximately $258 per square foot. 2341 SW 43rd St Unit Lot 8 is a home located in Deschutes County with nearby schools including Sage Elementary School, Obsidian Middle School, and Ridgeview High School.
Ownership History
Date
Name
Owned For
Owner Type
Purchase Details
Closed on
Apr 5, 2024
Sold by
Lampella Gary Curtis and Lampella Margie Lavern
Bought by
Lampella Family Trust and Lampella
Current Estimated Value
Purchase Details
Closed on
Sep 11, 2019
Sold by
Mccabe Danny D
Bought by
Lampella Gary Curtis and Lampella Margie Lavern
Home Financials for this Owner
Home Financials are based on the most recent Mortgage that was taken out on this home.
Original Mortgage
$441,307
Interest Rate
3.7%
Mortgage Type
New Conventional
Purchase Details
Closed on
Dec 17, 2010
Sold by
Mccabe Danny D
Bought by
Mccabe Danny D and Mccabe Judith C
Home Financials for this Owner
Home Financials are based on the most recent Mortgage that was taken out on this home.
Original Mortgage
$299,600
Interest Rate
4.17%
Mortgage Type
VA
Purchase Details
Closed on
Jul 27, 2010
Sold by
Mccabe Danny D and Mccabe Judith C
Bought by
Mccabe Danny D and Mccabe Judith C
Purchase Details
Closed on
Apr 29, 2009
Sold by
Citimortgage Inc
Bought by
Mccabe Danny D and Mccabe Judith C
Home Financials for this Owner
Home Financials are based on the most recent Mortgage that was taken out on this home.
Original Mortgage
$302,000
Interest Rate
4.99%
Mortgage Type
VA
Purchase Details
Closed on
Oct 3, 2008
Sold by
Franck Jim and Franck Nenita
Bought by
Citimortgage Inc
Purchase Details
Closed on
Apr 28, 2006
Sold by
Veen Jacqueline S
Bought by
Franck Jim and Franck Nenita
Home Financials for this Owner
Home Financials are based on the most recent Mortgage that was taken out on this home.
Original Mortgage
$432,000
Interest Rate
6.46%
Mortgage Type
Construction
Purchase Details
Closed on
Jan 31, 2006
Sold by
Veen Richard I and Veen Vanessa A
Bought by
Veen Jacqueline S and The L & J Veen Trust
Home Financials for this Owner
Home Financials are based on the most recent Mortgage that was taken out on this home.
Original Mortgage
$90,000
Interest Rate
6.28%
Mortgage Type
Seller Take Back
Purchase Details
Closed on
Jan 30, 2006
Sold by
West Mont R
Bought by
Veen Richard I and Veen Vanessa A
Home Financials for this Owner
Home Financials are based on the most recent Mortgage that was taken out on this home.
Original Mortgage
$90,000
Interest Rate
6.28%
Mortgage Type
Seller Take Back
Purchase Details
Closed on
May 19, 2005
Sold by
Talmage Construction Inc
Bought by
West Mont R
Create a Home Valuation Report for This Property
The Home Valuation Report is an in-depth analysis detailing your home's value as well as a comparison with similar homes in the area
Home Values in the Area
Average Home Value in this Area
Purchase History
| Date | Buyer | Sale Price | Title Company |
|---|---|---|---|
| Lampella Family Trust | -- | None Listed On Document | |
| Lampella Gary Curtis | $507,250 | Deschutes County Title | |
| Mccabe Danny D | -- | Accommodation | |
| Mccabe Danny D | -- | None Available | |
| Mccabe Danny D | $302,000 | First American Title | |
| Citimortgage Inc | $436,000 | First American Title | |
| Franck Jim | $182,700 | Amerititle | |
| Veen Jacqueline S | -- | Accommodation | |
| Veen Richard I | $140,000 | Amerititle | |
| West Mont R | $195,000 | Western Title & Escrow Co |
Source: Public Records
Mortgage History
| Date | Status | Borrower | Loan Amount |
|---|---|---|---|
| Previous Owner | Lampella Gary Curtis | $441,307 | |
| Previous Owner | Mccabe Danny D | $299,600 | |
| Previous Owner | Mccabe Danny D | $302,000 | |
| Previous Owner | Franck Jim | $432,000 | |
| Previous Owner | Veen Richard I | $90,000 |
Source: Public Records
Tax History Compared to Growth
Tax History
| Year | Tax Paid | Tax Assessment Tax Assessment Total Assessment is a certain percentage of the fair market value that is determined by local assessors to be the total taxable value of land and additions on the property. | Land | Improvement |
|---|---|---|---|---|
| 2025 | $6,691 | $328,140 | -- | -- |
| 2024 | $6,419 | $318,590 | -- | -- |
| 2023 | $6,139 | $309,320 | $0 | $0 |
| 2022 | $5,581 | $291,580 | $0 | $0 |
| 2021 | $5,396 | $283,090 | $0 | $0 |
| 2020 | $5,153 | $283,090 | $0 | $0 |
| 2019 | $4,454 | $274,850 | $0 | $0 |
| 2018 | $4,343 | $266,850 | $0 | $0 |
| 2017 | $4,239 | $259,080 | $0 | $0 |
| 2016 | $4,181 | $251,540 | $0 | $0 |
| 2015 | $4,053 | $244,220 | $0 | $0 |
| 2014 | $3,946 | $237,110 | $0 | $0 |
Source: Public Records
Map
Nearby Homes
- 2133 SW 43rd St Unit Lot 14
- 2155 SW 43rd St Unit Lot 15
- 2111 SW 43rd St Unit Lot 13
- 2449 SW 43rd St
- 4129 SW Majestic Ave
- 4337 SW Rhyolite Place Unit Lot 19
- 4315 SW Rhyolite Place Unit Lot 18
- 2511 SW 43rd Ct
- 4317 SW Reindeer Ave Unit Lot 11
- 2115 SW 37th St
- 3735 SW Timber Ave
- 4037 SW 38th St Unit Lot 44
- 4082 SW 38th St Unit Lot 41
- 4070 SW 38th St Unit Lot 42
- 2021 SW 37th St
- 3616 SW Hillcrest Dr
- 2917 SW 37th Ct
- 4677 SW Volcano Ave
- Miranda Premier Plan at Feather Ridge
- Metolius Premier Plan at Feather Ridge
- 2341 SW 43rd St
- 2323 SW 43rd St
- 2348 SW 43rd St
- 2338 SW Forked Horn Butte Rd
- 2357 SW 43rd St
- 2334 SW 43rd St
- 2322 SW 43rd St Unit 13
- 2322 SW 43rd St
- 2346 SW Forked Horn Butte Rd
- 2362 SW Forked Horn Butte Rd
- 2413 SW 43rd St
- 2356 SW 43rd St
- 0 SW Lots 2 & 45 Forked Horn Butte Ave Unit 201609608
- 4171 SW Salmon Place
- 4171 SW Salmon Place
- 2414 SW Forked Horn Butte Rd
- 4255 SW Salmon Ave
- 2260 SW 43rd St
- 4153 SW Salmon Place