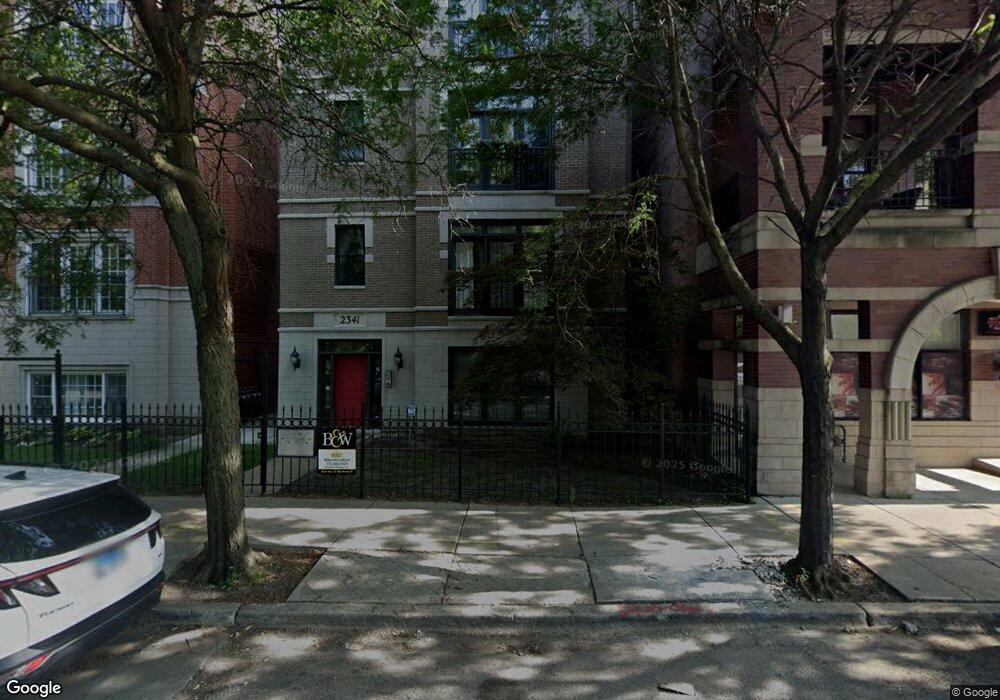
2341 W Montrose Ave Unit P3 Chicago, IL 60618
North Center NeighborhoodEstimated Value: $437,000 - $745,000
--
Bed
--
Bath
--
Sq Ft
4,704
Sq Ft Lot
About This Home
This home is located at 2341 W Montrose Ave Unit P3, Chicago, IL 60618 and is currently estimated at $591,000. 2341 W Montrose Ave Unit P3 is a home located in Cook County with nearby schools including Coonley Elementary School, Amundsen High School, and Queen Of Angels Elementary School.
Ownership History
Date
Name
Owned For
Owner Type
Purchase Details
Closed on
Jun 21, 2019
Sold by
Bangayan Jerel and Skrmetti Margaret
Bought by
Bangayan Jerel M and Skrmetti Margaret J
Current Estimated Value
Purchase Details
Closed on
Dec 3, 2016
Sold by
Shah Neeraj and Shah Binita S
Bought by
Bangayan Jerel and Skrmetti Margaret
Home Financials for this Owner
Home Financials are based on the most recent Mortgage that was taken out on this home.
Original Mortgage
$482,125
Outstanding Balance
$394,965
Interest Rate
4%
Mortgage Type
Adjustable Rate Mortgage/ARM
Estimated Equity
$196,035
Purchase Details
Closed on
May 16, 2003
Sold by
Paley Michael D and Paley Diane
Bought by
Wilmoth Roy L
Home Financials for this Owner
Home Financials are based on the most recent Mortgage that was taken out on this home.
Original Mortgage
$332,000
Interest Rate
5.88%
Mortgage Type
Purchase Money Mortgage
Create a Home Valuation Report for This Property
The Home Valuation Report is an in-depth analysis detailing your home's value as well as a comparison with similar homes in the area
Home Values in the Area
Average Home Value in this Area
Purchase History
| Date | Buyer | Sale Price | Title Company |
|---|---|---|---|
| Bangayan Jerel M | -- | Attorney | |
| Bangayan Jerel | $507,500 | Chicago Title | |
| Wilmoth Roy L | $424,500 | First American Title | |
| Wilmoth Roy L | $424,500 | First American Title |
Source: Public Records
Mortgage History
| Date | Status | Borrower | Loan Amount |
|---|---|---|---|
| Open | Bangayan Jerel | $482,125 | |
| Previous Owner | Wilmoth Roy L | $332,000 |
Source: Public Records
Tax History Compared to Growth
Tax History
| Year | Tax Paid | Tax Assessment Tax Assessment Total Assessment is a certain percentage of the fair market value that is determined by local assessors to be the total taxable value of land and additions on the property. | Land | Improvement |
|---|---|---|---|---|
| 2024 | $527 | $3,807 | $803 | $3,004 |
| 2023 | $514 | $2,500 | $648 | $1,852 |
| 2022 | $514 | $2,500 | $648 | $1,852 |
| 2021 | $503 | $2,499 | $648 | $1,851 |
| 2020 | $588 | $2,640 | $345 | $2,295 |
| 2019 | $583 | $2,903 | $345 | $2,558 |
| 2018 | $573 | $2,903 | $345 | $2,558 |
| 2017 | $632 | $2,936 | $302 | $2,634 |
| 2016 | $588 | $2,936 | $302 | $2,634 |
| 2015 | $538 | $2,936 | $302 | $2,634 |
| 2014 | $501 | $2,699 | $232 | $2,467 |
| 2013 | $491 | $2,699 | $232 | $2,467 |
Source: Public Records
Map
Nearby Homes
- 2321 W Montrose Ave
- 2461 W Pensacola Ave
- 2438 W Berteau Ave
- 2468 W Berteau Ave
- 2238 W Wilson Ave Unit 2N
- 2163 W Windsor Ave
- 2415 W Belle Plaine Ave
- 2224 W Eastwood Ave
- 2335 W Belle Plaine Ave Unit 207
- 2335 W Belle Plaine Ave Unit 508
- 2335 W Belle Plaine Ave Unit 211
- 2335 W Belle Plaine Ave Unit 205
- 2107 W Berteau Ave
- 2455 W Leland Ave Unit 1
- 2034 W Sunnyside Ave
- 2039 W Berteau Ave
- 2540 W Leland Ave Unit 2
- 2244 W Irving Park Rd
- 2617 W Leland Ave Unit 1
- 4751 N Artesian Ave Unit 409
- 2341 W Montrose Ave Unit 23414
- 2341 W Montrose Ave Unit 23411
- 2341 W Montrose Ave Unit P2
- 2341 W Montrose Ave Unit P4
- 2341 W Montrose Ave Unit P1
- 2341 W Montrose Ave Unit 23413
- 2341 W Montrose Ave Unit 23412
- 2341 W Montrose Ave Unit 1
- 2341 W Montrose Ave Unit 2
- 2343 W Montrose Ave Unit G2
- 2343 W Montrose Ave Unit 301
- 2343 W Montrose Ave Unit G5
- 2343 W Montrose Ave Unit G4
- 2343 W Montrose Ave Unit 201
- 2343 W Montrose Ave Unit G3
- 2343 W Montrose Ave Unit G6
- 2343 W Montrose Ave Unit G1
- 2343 W Montrose Ave Unit A
- 2339 W Montrose Ave Unit 4
- 2339 W Montrose Ave Unit P1