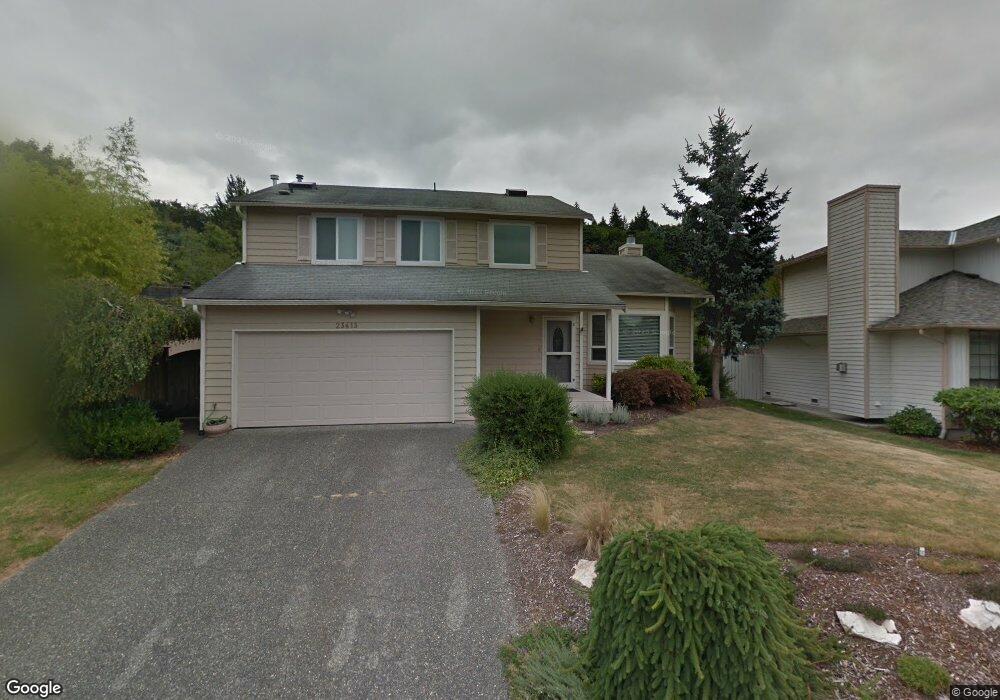
23413 9th Place W Bothell, WA 98021
Queensborough-Brentwood NeighborhoodEstimated Value: $1,033,000 - $1,196,000
4
Beds
3
Baths
2,403
Sq Ft
$465/Sq Ft
Est. Value
About This Home
This home is located at 23413 9th Place W, Bothell, WA 98021 and is currently estimated at $1,116,234, approximately $464 per square foot. 23413 9th Place W is a home located in Snohomish County with nearby schools including Lockwood Elementary School, Kenmore Middle School, and Bothell High School.
Ownership History
Date
Name
Owned For
Owner Type
Purchase Details
Closed on
Dec 30, 2019
Sold by
Ross Bryan Christopher
Bought by
King Lisa Barber
Current Estimated Value
Purchase Details
Closed on
May 13, 2009
Sold by
Moffitt Dorothy and Moffitt Dorothy M
Bought by
Ross Bryan Christopher and Ross Lisa Barber
Home Financials for this Owner
Home Financials are based on the most recent Mortgage that was taken out on this home.
Original Mortgage
$351,490
Interest Rate
4.82%
Mortgage Type
VA
Purchase Details
Closed on
Oct 10, 2005
Sold by
Estate Of David H Moffitt and Moffitt Dorothy
Bought by
Moffitt Dorothy
Create a Home Valuation Report for This Property
The Home Valuation Report is an in-depth analysis detailing your home's value as well as a comparison with similar homes in the area
Home Values in the Area
Average Home Value in this Area
Purchase History
| Date | Buyer | Sale Price | Title Company |
|---|---|---|---|
| King Lisa Barber | -- | None Available | |
| Ross Bryan Christopher | $389,000 | Talon Group | |
| Moffitt Dorothy | -- | First American Title Ins Co |
Source: Public Records
Mortgage History
| Date | Status | Borrower | Loan Amount |
|---|---|---|---|
| Previous Owner | Ross Bryan Christopher | $351,490 |
Source: Public Records
Tax History Compared to Growth
Tax History
| Year | Tax Paid | Tax Assessment Tax Assessment Total Assessment is a certain percentage of the fair market value that is determined by local assessors to be the total taxable value of land and additions on the property. | Land | Improvement |
|---|---|---|---|---|
| 2025 | $7,276 | $869,500 | $550,000 | $319,500 |
| 2024 | $7,276 | $863,400 | $555,000 | $308,400 |
| 2023 | $7,682 | $993,500 | $640,000 | $353,500 |
| 2022 | $7,055 | $730,000 | $430,000 | $300,000 |
| 2020 | $5,963 | $572,900 | $311,000 | $261,900 |
| 2019 | $5,282 | $519,300 | $260,000 | $259,300 |
| 2018 | $4,955 | $459,100 | $225,000 | $234,100 |
| 2017 | $4,133 | $392,600 | $175,000 | $217,600 |
| 2016 | $3,975 | $365,500 | $160,000 | $205,500 |
| 2015 | $3,900 | $337,500 | $145,000 | $192,500 |
| 2013 | $3,721 | $280,000 | $124,000 | $156,000 |
Source: Public Records
Map
Nearby Homes
- 23404 8th Place W
- 23723 9th Place W
- 23621 7th Ave W
- 23318 3rd Place W
- 612 228th St SW Unit K201
- 23916 7th Place W
- 722 Wandering Creek Dr
- 24004 10th Place W
- 1313 228th Place SW
- 1121 244th St SW Unit 44
- 1121 244th St SW Unit 19
- 1121 244th St SW Unit 66
- 24123 7th Ave W
- 1211 244th St SW Unit 11
- 201 240th St SW
- 16 234th Place SE
- 22619 4th Ave W Unit 102
- 22718 1st Place W
- 22502 3rd Place W
- 20343 75th Ave NE
- 23423 9th Place W
- 23411 9th Place W
- 23416 8th Place W
- 23410 8th Place W
- 23422 8th Place W
- 23429 9th Place W
- 23405 9th Place W
- 23428 8th Place W
- 23418 9th Place W
- 1000 233rd Place SW Unit 1
- 23431 9th Place W
- 23412 9th Place W
- 23426 9th Place W
- 23502 8th Place W
- 23322 8th Place W
- 23415 8th Place W
- 902 233rd Place SW
- 23409 8th Place W
- 23421 8th Place W
- 921 235th St SW