Estimated Value: $288,787 - $338,000
3
Beds
1
Bath
1,624
Sq Ft
$197/Sq Ft
Est. Value
About This Home
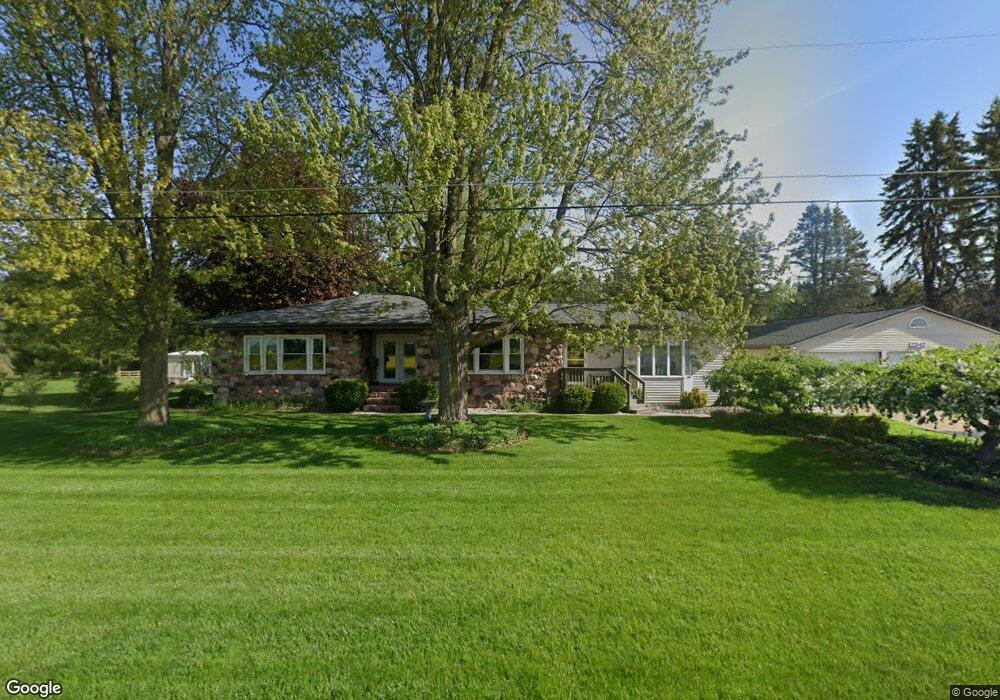
This home is located at 2342 Coy Rd, Mason, MI 48854 and is currently estimated at $319,697, approximately $196 per square foot. 2342 Coy Rd is a home located in Ingham County with nearby schools including Mason High School.
Ownership History
Date
Name
Owned For
Owner Type
Purchase Details
Closed on
Apr 28, 2021
Sold by
Parker Jeanne M
Bought by
Parker Jeanne M and Christensen Michael R
Current Estimated Value
Purchase Details
Closed on
May 26, 2016
Sold by
Parker Jeanne M
Bought by
Parker Jeanne M
Create a Home Valuation Report for This Property
The Home Valuation Report is an in-depth analysis detailing your home's value as well as a comparison with similar homes in the area
Home Values in the Area
Average Home Value in this Area
Purchase History
| Date | Buyer | Sale Price | Title Company |
|---|---|---|---|
| Parker Jeanne M | -- | None Available | |
| Parker Jeanne M | -- | None Available |
Source: Public Records
Tax History Compared to Growth
Tax History
| Year | Tax Paid | Tax Assessment Tax Assessment Total Assessment is a certain percentage of the fair market value that is determined by local assessors to be the total taxable value of land and additions on the property. | Land | Improvement |
|---|---|---|---|---|
| 2025 | $2,702 | $123,550 | $23,650 | $99,900 |
| 2024 | $16 | $115,300 | $21,250 | $94,050 |
| 2023 | $2,510 | $103,650 | $19,750 | $83,900 |
| 2022 | $2,386 | $95,250 | $19,200 | $76,050 |
| 2021 | $2,344 | $93,300 | $17,050 | $76,250 |
| 2020 | $2,303 | $82,900 | $17,050 | $65,850 |
| 2019 | $2,219 | $79,350 | $15,700 | $63,650 |
| 2018 | $2,180 | $76,150 | $14,650 | $61,500 |
| 2017 | $1,884 | $74,800 | $14,250 | $60,550 |
| 2016 | -- | $72,750 | $13,900 | $58,850 |
| 2015 | -- | $68,600 | $27,433 | $41,167 |
| 2014 | -- | $66,900 | $24,827 | $42,073 |
Source: Public Records
Map
Nearby Homes
- 2474 Tomlinson Rd
- Lot 6 Sleeping Meadow Dr
- 1600 Tuttle Rd
- 917 Chickasaw Dr
- 2185 W Barnes Rd
- 1304 Ives Rd
- 3230 Tomlinson Rd
- 833 S Barnes St
- 915 Carom Cir
- 901 Carom Cir Unit 145
- 814 Carom Cir Unit 142
- 311 Carom Cir
- 709 Judy Ct
- 416 E Elm St
- 116 E Elm St
- 831 Eugenia Dr
- 1977 Ives Rd
- 427 E Ash St
- 709 Roosevelt St
- 411 W Ash St