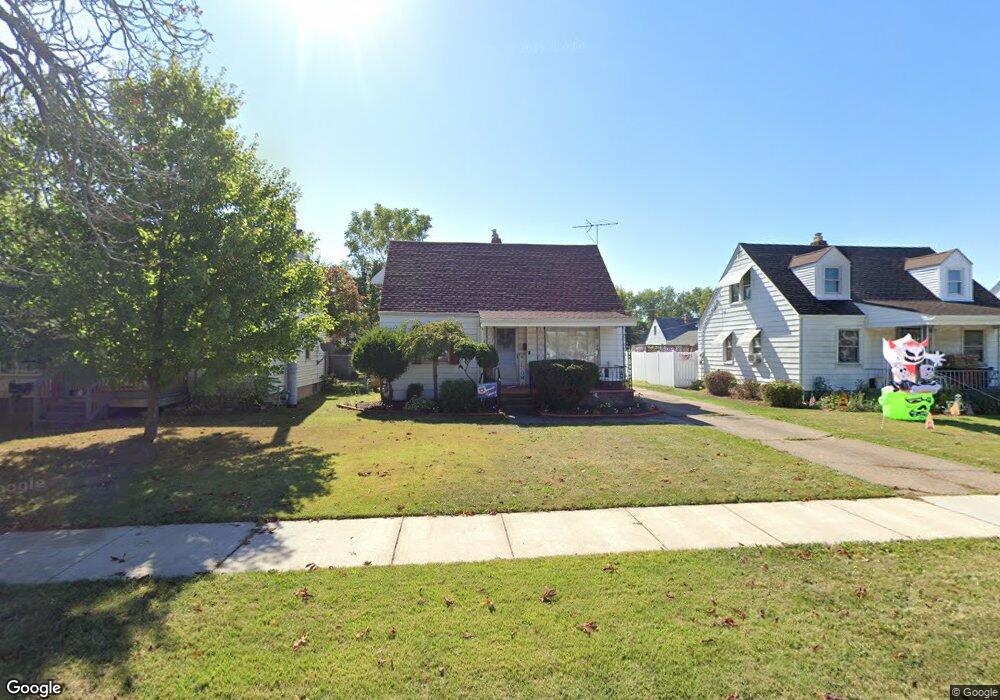
2342 E 34th St Lorain, OH 44055
Estimated Value: $114,000 - $125,000
3
Beds
1
Bath
1,101
Sq Ft
$108/Sq Ft
Est. Value
About This Home
This home is located at 2342 E 34th St, Lorain, OH 44055 and is currently estimated at $119,431, approximately $108 per square foot. 2342 E 34th St is a home located in Lorain County with nearby schools including Palm Elementary School, Southview Middle School, and Lorain High School.
Ownership History
Date
Name
Owned For
Owner Type
Purchase Details
Closed on
Oct 18, 2015
Sold by
Yelenic Dannis Charles and Yelenic Susan
Bought by
Home Fix Llc
Current Estimated Value
Purchase Details
Closed on
Apr 23, 2008
Sold by
Wells Fargo Bank Na
Bought by
Yelenic Dennis
Purchase Details
Closed on
Nov 14, 2007
Sold by
Morgan Hersel R and Morgan Shelly A
Bought by
Wells Fargo Bank Na and First Franklin Mortgage Loan Trust 2003-
Purchase Details
Closed on
Jun 13, 2003
Sold by
Nereida Falcon and Fleming Nereida
Bought by
Morgan Hersel R and Morgan Shelly A
Home Financials for this Owner
Home Financials are based on the most recent Mortgage that was taken out on this home.
Original Mortgage
$92,000
Interest Rate
7.75%
Mortgage Type
Purchase Money Mortgage
Create a Home Valuation Report for This Property
The Home Valuation Report is an in-depth analysis detailing your home's value as well as a comparison with similar homes in the area
Home Values in the Area
Average Home Value in this Area
Purchase History
| Date | Buyer | Sale Price | Title Company |
|---|---|---|---|
| Home Fix Llc | -- | None Available | |
| Yelenic Dennis | $38,900 | Accutitle Agency Inc | |
| Wells Fargo Bank Na | $56,000 | None Available | |
| Morgan Hersel R | $92,000 | Homescore Title |
Source: Public Records
Mortgage History
| Date | Status | Borrower | Loan Amount |
|---|---|---|---|
| Previous Owner | Morgan Hersel R | $92,000 |
Source: Public Records
Tax History
| Year | Tax Paid | Tax Assessment Tax Assessment Total Assessment is a certain percentage of the fair market value that is determined by local assessors to be the total taxable value of land and additions on the property. | Land | Improvement |
|---|---|---|---|---|
| 2024 | $1,275 | $30,170 | $3,920 | $26,250 |
| 2023 | $716 | $13,556 | $3,696 | $9,860 |
| 2022 | $710 | $13,556 | $3,696 | $9,860 |
| 2021 | $710 | $13,556 | $3,696 | $9,860 |
| 2020 | $659 | $10,920 | $2,980 | $7,940 |
| 2019 | $655 | $10,920 | $2,980 | $7,940 |
| 2018 | $655 | $10,920 | $2,980 | $7,940 |
| 2017 | $1,043 | $16,390 | $4,030 | $12,360 |
| 2016 | $1,035 | $16,390 | $4,030 | $12,360 |
| 2015 | $978 | $16,390 | $4,030 | $12,360 |
| 2014 | $933 | $15,680 | $3,850 | $11,830 |
| 2013 | $926 | $15,680 | $3,850 | $11,830 |
Source: Public Records
Map
Nearby Homes
- 2217 E 32nd St
- 3308 Norfolk Ave
- 2228 E 30th St
- 4061 Gregus Ave
- 2129 E 30th St
- V/L Grove Ave
- V/L Clinton Ave
- 1924 E 33rd St
- 4510 Riverside Dr
- 4608 Gary Ave
- 4617 Andover Ave
- 4210 Seneca Ave
- 1829 E 33rd St
- 1816 E 34th St
- V/L Pearl Ave
- VL Ridgewood St
- 5193 Liberty Ave
- 3885 Dale Ave
- 1685 E 36th St
- V/L Rear Land Unit 1
Your Personal Tour Guide
Ask me questions while you tour the home.