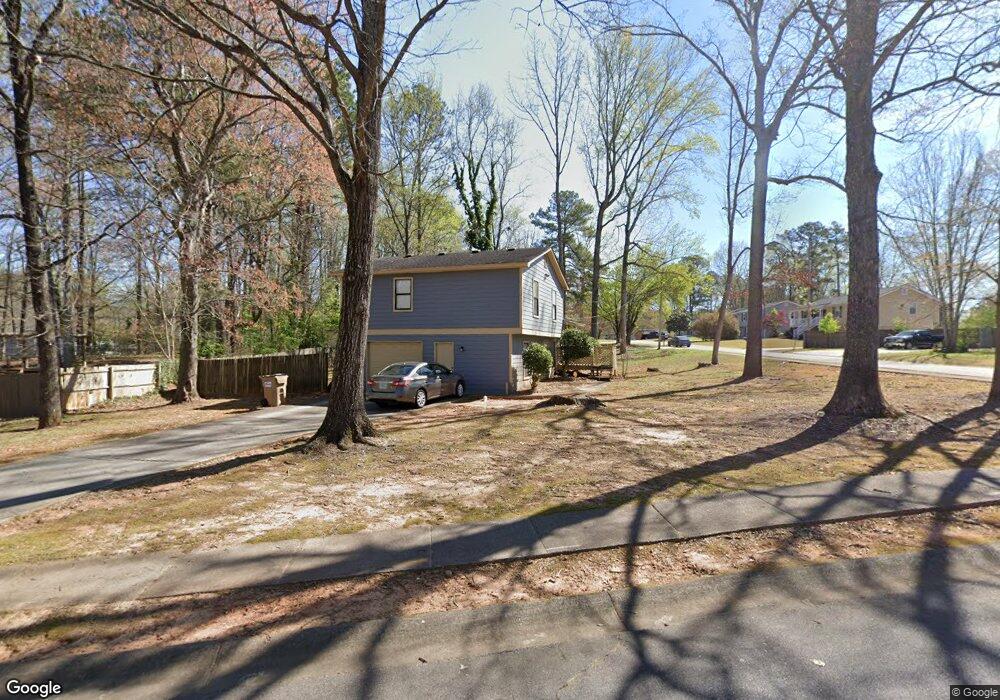
2342 Targa Ln SW Marietta, GA 30064
Estimated Value: $313,000 - $350,958
3
Beds
2
Baths
1,645
Sq Ft
$203/Sq Ft
Est. Value
About This Home
This home is located at 2342 Targa Ln SW, Marietta, GA 30064 and is currently estimated at $334,490, approximately $203 per square foot. 2342 Targa Ln SW is a home located in Cobb County with nearby schools including Hollydale Elementary School, Smitha Middle School, and Osborne High School.
Ownership History
Date
Name
Owned For
Owner Type
Purchase Details
Closed on
Aug 13, 2010
Sold by
Monterey Investments Llc
Bought by
Perez Marcelo A
Current Estimated Value
Purchase Details
Closed on
Feb 2, 2010
Sold by
Dominguez Alfonso
Bought by
Bank Of Ny Mellon
Purchase Details
Closed on
Jan 15, 2002
Sold by
Killmett Clay P and Killmett Patrick T
Bought by
Moninguez Alfonso
Home Financials for this Owner
Home Financials are based on the most recent Mortgage that was taken out on this home.
Original Mortgage
$112,955
Interest Rate
7.08%
Mortgage Type
New Conventional
Purchase Details
Closed on
Jul 20, 2000
Sold by
Smith Donald L
Bought by
Killmett Clay P and Killmett Patrick T
Home Financials for this Owner
Home Financials are based on the most recent Mortgage that was taken out on this home.
Original Mortgage
$108,950
Interest Rate
8.12%
Mortgage Type
FHA
Create a Home Valuation Report for This Property
The Home Valuation Report is an in-depth analysis detailing your home's value as well as a comparison with similar homes in the area
Home Values in the Area
Average Home Value in this Area
Purchase History
| Date | Buyer | Sale Price | Title Company |
|---|---|---|---|
| Perez Marcelo A | $65,000 | -- | |
| Bank Of Ny Mellon | $52,000 | -- | |
| Moninguez Alfonso | $118,900 | -- | |
| Killmett Clay P | $109,900 | -- |
Source: Public Records
Mortgage History
| Date | Status | Borrower | Loan Amount |
|---|---|---|---|
| Previous Owner | Moninguez Alfonso | $112,955 | |
| Previous Owner | Killmett Clay P | $108,950 |
Source: Public Records
Tax History Compared to Growth
Tax History
| Year | Tax Paid | Tax Assessment Tax Assessment Total Assessment is a certain percentage of the fair market value that is determined by local assessors to be the total taxable value of land and additions on the property. | Land | Improvement |
|---|---|---|---|---|
| 2025 | $3,632 | $120,560 | $28,000 | $92,560 |
| 2024 | $3,503 | $116,184 | $20,000 | $96,184 |
| 2023 | $3,028 | $100,424 | $20,000 | $80,424 |
| 2022 | $2,694 | $88,756 | $14,000 | $74,756 |
| 2021 | $2,245 | $73,960 | $14,000 | $59,960 |
| 2020 | $1,862 | $61,356 | $14,000 | $47,356 |
| 2019 | $1,611 | $53,076 | $8,800 | $44,276 |
| 2018 | $1,611 | $53,076 | $8,800 | $44,276 |
| 2017 | $1,216 | $42,300 | $8,000 | $34,300 |
| 2016 | $1,216 | $42,300 | $8,000 | $34,300 |
| 2015 | $1,037 | $35,188 | $8,000 | $27,188 |
| 2014 | $747 | $25,148 | $0 | $0 |
Source: Public Records
Map
Nearby Homes
- 2720 Cold Springs Trail SW
- 2060 Powder Springs Rd SW
- 2450 Horseshoe Bend Rd SW
- 2415 Bankstone Dr SW
- 2608 Foxwood Place SW Unit IV
- 1970 Powder Springs Rd SW
- 2318 Powder Springs Rd SW
- 2554 Red Barn Rd SW
- 2126 Green Dr SW
- 2490 Wood Meadows Dr SW
- 0 Burfordi Dr SW Unit 7658493
- 0 Burfordi Dr SW Unit 10637361
- 2448 Wood Meadows Dr SW
- 2166 Derbyshire Dr SW
- 3000 Fern Valley Dr SW
- 2625 Deerfield Cir SW
- 2117 Caneridge Dr SW
- 3112 Patriot Square SW
- 3047 Patriot Square SW
- 2653 Bridgehampton Rd SW
- 2340 Targa Ln SW
- 2657 Bridgehampton Rd SW
- 2338 Targa Ln SW
- 2652 Bridgehampton Rd SW
- 2656 Bridgehampton Rd SW Unit 3
- 2339 Targa Ln SW
- 2654 Bridgehampton Rd SW
- 2651 Bridgehampton Rd SW Unit 3
- 0 Targa Ln SW Unit 7162029
- 0 Targa Ln SW
- 2341 Goodwood Dr SW
- 2336 Targa Ln SW Unit IV
- 2337 Targa Ln SW
- 0 Bridgehampton Rd SW Unit 7007427
- 0 Bridgehampton Rd SW Unit 7513851
- 0 Bridgehampton Rd SW Unit 7474068
- 0 Bridgehampton Rd SW Unit 7433338
- 0 Bridgehampton Rd SW Unit 8014286
- 0 Bridgehampton Rd SW