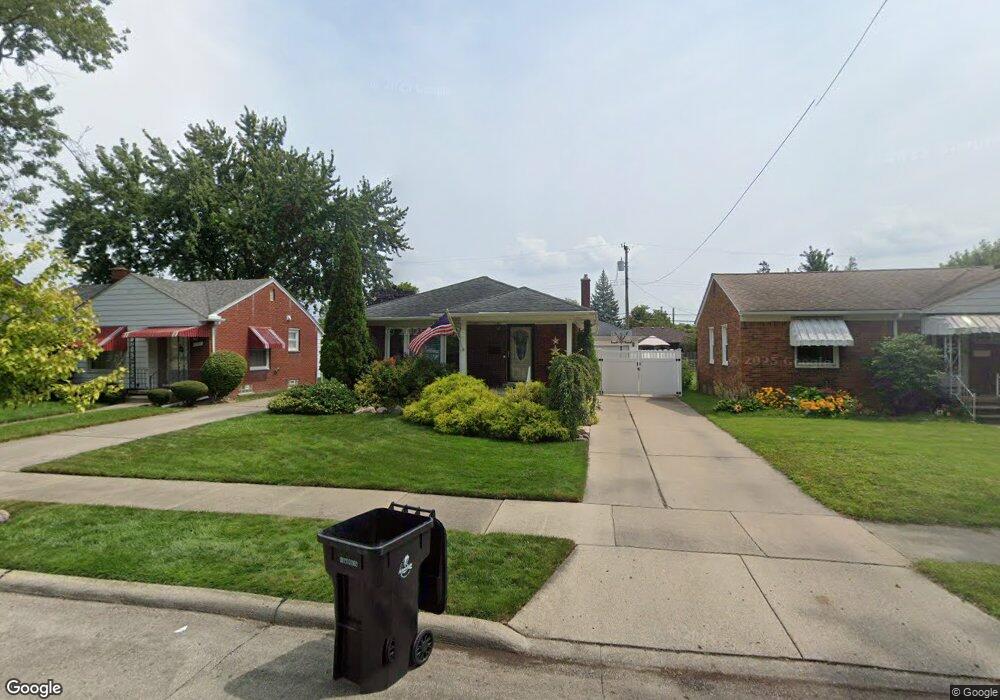
2343 19th St Wyandotte, MI 48192
Estimated Value: $223,626 - $267,000
--
Bed
--
Bath
1,107
Sq Ft
$223/Sq Ft
Est. Value
About This Home
This home is located at 2343 19th St, Wyandotte, MI 48192 and is currently estimated at $246,907, approximately $223 per square foot. 2343 19th St is a home located in Wayne County with nearby schools including Washington Elementary School, Woodrow Wilson School, and Roosevelt High School.
Ownership History
Date
Name
Owned For
Owner Type
Purchase Details
Closed on
Jun 29, 2006
Sold by
Migliaccio Phillip J and Migliaccio Linda L
Bought by
Kearney Sean P
Current Estimated Value
Home Financials for this Owner
Home Financials are based on the most recent Mortgage that was taken out on this home.
Original Mortgage
$129,360
Outstanding Balance
$76,925
Interest Rate
6.68%
Mortgage Type
Purchase Money Mortgage
Estimated Equity
$169,982
Purchase Details
Closed on
Jan 29, 2001
Sold by
Pierce Cole
Bought by
Pierce Brent F
Create a Home Valuation Report for This Property
The Home Valuation Report is an in-depth analysis detailing your home's value as well as a comparison with similar homes in the area
Home Values in the Area
Average Home Value in this Area
Purchase History
| Date | Buyer | Sale Price | Title Company |
|---|---|---|---|
| Kearney Sean P | $161,700 | Home Title Connect Llc | |
| Pierce Brent F | -- | -- |
Source: Public Records
Mortgage History
| Date | Status | Borrower | Loan Amount |
|---|---|---|---|
| Open | Kearney Sean P | $129,360 |
Source: Public Records
Tax History Compared to Growth
Tax History
| Year | Tax Paid | Tax Assessment Tax Assessment Total Assessment is a certain percentage of the fair market value that is determined by local assessors to be the total taxable value of land and additions on the property. | Land | Improvement |
|---|---|---|---|---|
| 2025 | $2,299 | $102,900 | $0 | $0 |
| 2024 | $2,299 | $97,000 | $0 | $0 |
| 2023 | $2,193 | $87,600 | $0 | $0 |
| 2022 | $2,540 | $80,100 | $0 | $0 |
| 2021 | $2,489 | $75,400 | $0 | $0 |
| 2020 | $2,455 | $66,700 | $0 | $0 |
| 2019 | $2,421 | $61,600 | $0 | $0 |
| 2018 | $1,932 | $52,300 | $0 | $0 |
| 2017 | $846 | $52,300 | $0 | $0 |
| 2016 | $2,337 | $47,500 | $0 | $0 |
| 2015 | $4,170 | $44,100 | $0 | $0 |
| 2013 | $4,040 | $40,400 | $0 | $0 |
| 2012 | $1,856 | $41,600 | $8,400 | $33,200 |
Source: Public Records
Map
Nearby Homes