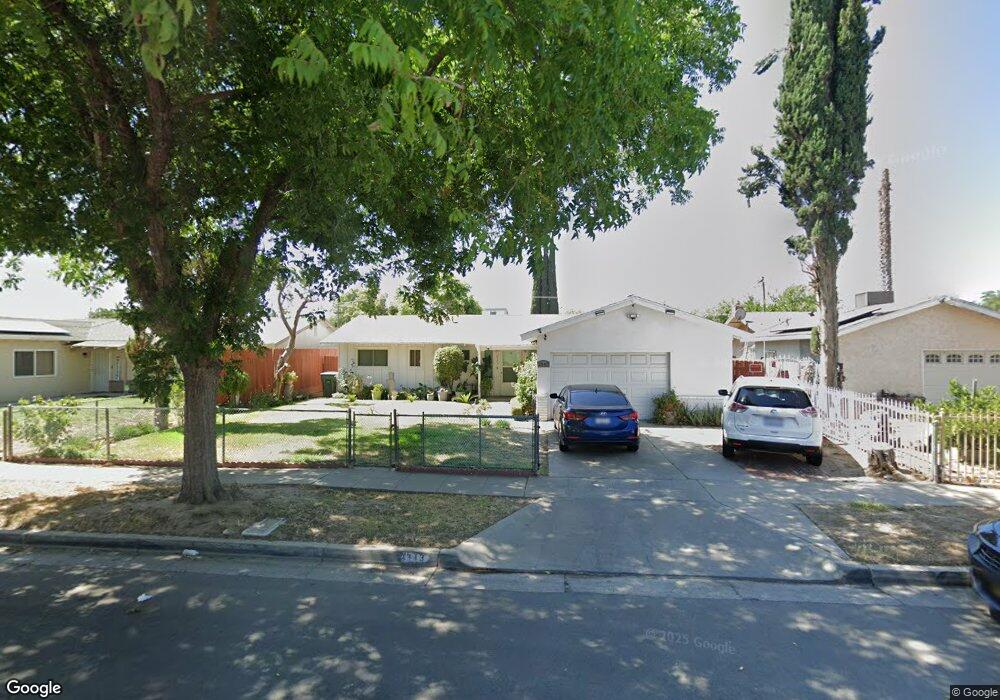
2343 W Swift Ave Fresno, CA 93705
Bullard NeighborhoodEstimated Value: $283,000 - $410,000
3
Beds
2
Baths
1,200
Sq Ft
$279/Sq Ft
Est. Value
About This Home
This home is located at 2343 W Swift Ave, Fresno, CA 93705 and is currently estimated at $334,353, approximately $278 per square foot. 2343 W Swift Ave is a home located in Fresno County with nearby schools including Wilson Elementary School, Fort Miller Middle School, and Fresno High School.
Ownership History
Date
Name
Owned For
Owner Type
Purchase Details
Closed on
Apr 5, 2010
Sold by
Dede La Pena Maricela Mendez
Bought by
Topete Salvador Antonio De Lapena
Current Estimated Value
Home Financials for this Owner
Home Financials are based on the most recent Mortgage that was taken out on this home.
Original Mortgage
$126,417
Outstanding Balance
$84,909
Interest Rate
5.25%
Mortgage Type
FHA
Estimated Equity
$249,444
Purchase Details
Closed on
Mar 11, 2010
Sold by
Manrique Alfonso and Borrelli Concetta
Bought by
Topete Salvador Antonio De La Pena
Home Financials for this Owner
Home Financials are based on the most recent Mortgage that was taken out on this home.
Original Mortgage
$126,417
Outstanding Balance
$84,909
Interest Rate
5.25%
Mortgage Type
FHA
Estimated Equity
$249,444
Purchase Details
Closed on
Nov 16, 2009
Sold by
Rds Financial
Bought by
Manrique Alfonso and Borrelli Concetta
Purchase Details
Closed on
Oct 16, 2009
Sold by
Alexander Betty E
Bought by
Rds Financial
Create a Home Valuation Report for This Property
The Home Valuation Report is an in-depth analysis detailing your home's value as well as a comparison with similar homes in the area
Home Values in the Area
Average Home Value in this Area
Purchase History
| Date | Buyer | Sale Price | Title Company |
|---|---|---|---|
| Topete Salvador Antonio De Lapena | -- | Chicago Title Company | |
| Topete Salvador Antonio De La Pena | $129,000 | Chicago Title Company | |
| Manrique Alfonso | -- | Chicago Title Company | |
| Rds Financial | -- | None Available |
Source: Public Records
Mortgage History
| Date | Status | Borrower | Loan Amount |
|---|---|---|---|
| Open | Topete Salvador Antonio De La Pena | $126,417 |
Source: Public Records
Tax History Compared to Growth
Tax History
| Year | Tax Paid | Tax Assessment Tax Assessment Total Assessment is a certain percentage of the fair market value that is determined by local assessors to be the total taxable value of land and additions on the property. | Land | Improvement |
|---|---|---|---|---|
| 2025 | $2,001 | $166,118 | $38,719 | $127,399 |
| 2023 | $1,961 | $159,668 | $37,216 | $122,452 |
| 2022 | $1,932 | $156,538 | $36,487 | $120,051 |
| 2021 | $1,878 | $153,470 | $35,772 | $117,698 |
| 2020 | $1,869 | $151,898 | $35,406 | $116,492 |
| 2019 | $1,796 | $148,920 | $34,712 | $114,208 |
| 2018 | $1,755 | $146,001 | $34,032 | $111,969 |
| 2017 | $1,723 | $143,139 | $33,365 | $109,774 |
| 2016 | $1,665 | $140,333 | $32,711 | $107,622 |
| 2015 | $1,639 | $138,226 | $32,220 | $106,006 |
| 2014 | $1,604 | $135,519 | $31,589 | $103,930 |
Source: Public Records
Map
Nearby Homes
- 4222 N Lafayette Ave
- 2706 W Ashlan Ave Unit 46
- 2706 W Ashlan Ave Unit 94
- 2706 W Ashlan Ave Unit 200
- 2706 W Ashlan Ave Unit 323
- 2706 W Ashlan Ave Unit 113
- 2706 W Ashlan Ave Unit 48
- 2706 W Ashlan Ave Unit 158
- 2706 W Ashlan Ave Unit 197
- 2706 W Ashlan Ave Unit 11
- 2706 W Ashlan Ave Unit 97
- 2706 W Ashlan Ave Unit 226
- 2706 W Ashlan Ave Unit 205
- 2706 W Ashlan Ave Unit 329
- 1905 W Buckingham Way
- 3992 N Briarwood Ave
- 4442 N Hacienda Dr
- 4630 N Lorna Ave
- 4382 N Crystal Ave
- 1934 W Pontiac Way
- 2333 W Swift Ave
- 2403 W Swift Ave
- 4224 N Lafayette Ave
- 2415 W Swift Ave
- 4239 N Kavanagh Ave
- 4225 N Lafayette Ave
- 4233 N Kavanagh Ave
- 2348 W Swift Ave
- 2340 W Swift Ave
- 2425 W Swift Ave
- 4229 N Kavanagh Ave
- 2408 W Swift Ave
- 2330 W Swift Ave
- 4223 N Lafayette Ave
- 2420 W Swift Ave
- 4225 N Kavanagh Ave
- 2320 W Swift Ave
- 4220 N Lafayette Ave
- 2353 W Holland Ave
- 4238 N Pleasant Ave