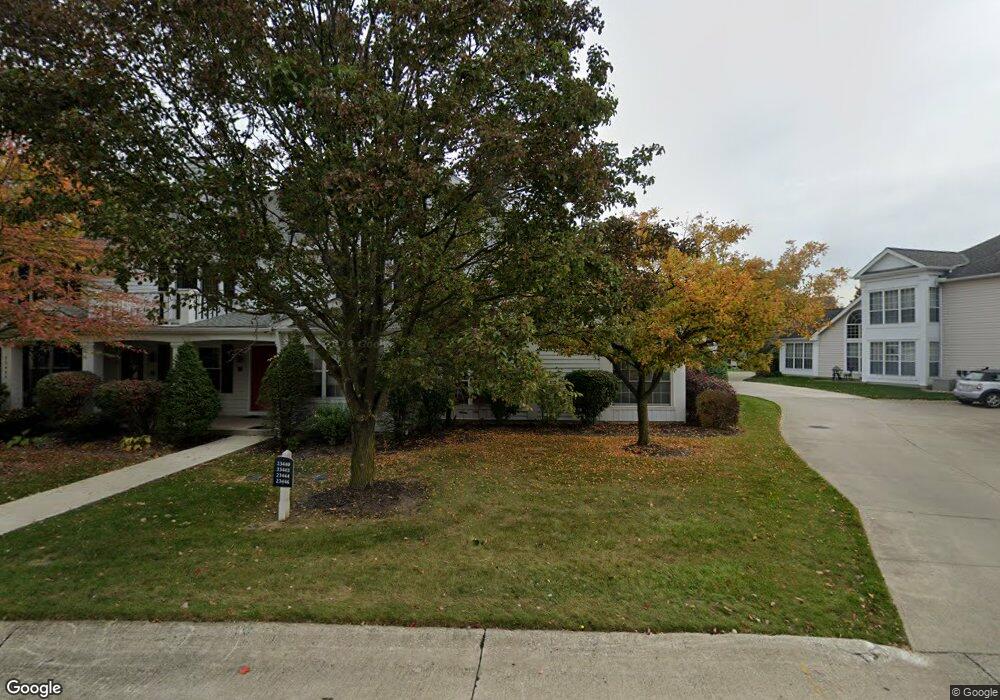
23440 Grist Mill Ct Unit 210 Olmsted Falls, OH 44138
Estimated Value: $161,000 - $243,000
2
Beds
2
Baths
1,779
Sq Ft
$121/Sq Ft
Est. Value
About This Home
This home is located at 23440 Grist Mill Ct Unit 210, Olmsted Falls, OH 44138 and is currently estimated at $215,146, approximately $120 per square foot. 23440 Grist Mill Ct Unit 210 is a home located in Cuyahoga County with nearby schools including Falls-Lenox Primary Elementary School, Olmsted Falls Intermediate Building, and Olmsted Falls Middle School.
Ownership History
Date
Name
Owned For
Owner Type
Purchase Details
Closed on
Dec 14, 2000
Sold by
Sima Kimberly Marie
Bought by
Stelmasczuk Patricia A
Current Estimated Value
Home Financials for this Owner
Home Financials are based on the most recent Mortgage that was taken out on this home.
Original Mortgage
$103,900
Outstanding Balance
$38,564
Interest Rate
7.8%
Estimated Equity
$176,582
Purchase Details
Closed on
Aug 31, 1999
Sold by
Hamilton Wayne F
Bought by
Sima Kimberly Marie and Sima Kimberly
Home Financials for this Owner
Home Financials are based on the most recent Mortgage that was taken out on this home.
Original Mortgage
$122,550
Interest Rate
7.59%
Purchase Details
Closed on
Jul 6, 1993
Sold by
Shorewest Const
Bought by
Hamilton Wayne F
Purchase Details
Closed on
Jan 1, 1992
Bought by
Shorewest Const
Create a Home Valuation Report for This Property
The Home Valuation Report is an in-depth analysis detailing your home's value as well as a comparison with similar homes in the area
Home Values in the Area
Average Home Value in this Area
Purchase History
| Date | Buyer | Sale Price | Title Company |
|---|---|---|---|
| Stelmasczuk Patricia A | $129,900 | -- | |
| Sima Kimberly Marie | $129,000 | American Title & Trust Agenc | |
| Hamilton Wayne F | $116,500 | -- | |
| Shorewest Const | -- | -- |
Source: Public Records
Mortgage History
| Date | Status | Borrower | Loan Amount |
|---|---|---|---|
| Open | Stelmasczuk Patricia A | $103,900 | |
| Previous Owner | Sima Kimberly Marie | $122,550 | |
| Closed | Stelmasczuk Patricia A | $12,950 |
Source: Public Records
Tax History Compared to Growth
Tax History
| Year | Tax Paid | Tax Assessment Tax Assessment Total Assessment is a certain percentage of the fair market value that is determined by local assessors to be the total taxable value of land and additions on the property. | Land | Improvement |
|---|---|---|---|---|
| 2024 | $3,890 | $68,565 | $6,860 | $61,705 |
| 2023 | $3,418 | $51,280 | $5,110 | $46,170 |
| 2022 | $3,417 | $51,280 | $5,110 | $46,170 |
| 2021 | $3,383 | $51,280 | $5,110 | $46,170 |
| 2020 | $3,090 | $43,090 | $4,310 | $38,780 |
| 2019 | $2,742 | $123,100 | $12,300 | $110,800 |
| 2018 | $2,707 | $43,090 | $4,310 | $38,780 |
| 2017 | $2,658 | $39,420 | $3,960 | $35,460 |
| 2016 | $2,643 | $39,420 | $3,960 | $35,460 |
| 2015 | $3,059 | $39,420 | $3,960 | $35,460 |
| 2014 | $3,059 | $43,790 | $4,380 | $39,410 |
Source: Public Records
Map
Nearby Homes
- 23390 Wainwright Terrace
- 23514 Grist Mill Ct Unit 4
- 23155 Wainwright Terrace
- 23002 Chandlers Ln
- 23002 Chandlers Ln Unit 342
- 23002 Chandlers Ln Unit 221
- 9797 Sugarbush Cir
- 23003 Chandlers Ln Unit 219
- 23003 Chandlers Ln Unit 230
- 537 Wyleswood Dr
- 543 Wyleswood Dr
- 549 Wyleswood Dr
- 647 Tampico Ct Unit 7
- 412 Wyleswood Dr
- 458 Sprague Rd
- 396 Crossbrook Dr
- V/L Aldridge Dr
- 9855 Dupont Dr
- 8809 Leatherleaf Dr
- 8896 Firethorne Dr
- 23442 Grist Mill Ct Unit 4
- 23444 Grist Mill Ct Unit 1
- 23446 Grist Mill Ct Unit 3
- 23446 Grist Mill Ct
- 23444 Grist Mill Ct Unit 10-1
- 23476 Grist Mill Ct Unit 3
- 23474 Grist Mill Ct Unit 8-1
- 23472 Grist Mill Ct Unit 4
- 23470 Grist Mill Ct Unit 2
- 23400 Grist Mill Ct Unit 2
- 23402 Grist Mill Ct
- 23406 Grist Mill Ct
- 23404 Grist Mill Ct
- 23400 Grist Mill Ct Unit 12-2
- 23402 Grist Mill Ct Unit 12-4
- 23497 Grist Mill Ct Unit 2
- 23491 Grist Mill Ct
- 23495 Grist Mill Ct
- 23493 Grist Mill Ct
- 23392 Grist Mill Ct Unit 1