Estimated Value: $323,000 - $361,512
4
Beds
1
Bath
1,508
Sq Ft
$229/Sq Ft
Est. Value
About This Home
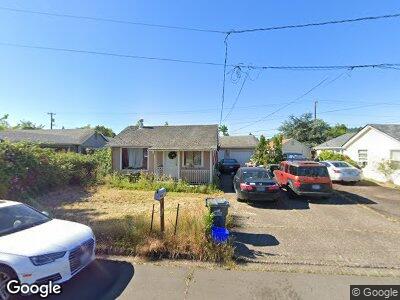
This home is located at 2345 F St, Springfield, OR 97477 and is currently estimated at $345,128, approximately $228 per square foot. 2345 F St is a home located in Lane County with nearby schools including Maple Elementary School, Briggs Middle School, and Springfield High School.
Ownership History
Date
Name
Owned For
Owner Type
Purchase Details
Closed on
Jan 17, 2007
Sold by
Huser Timothy C and Huser Linda G
Bought by
Deanda Steven and Deanda Maria
Current Estimated Value
Home Financials for this Owner
Home Financials are based on the most recent Mortgage that was taken out on this home.
Original Mortgage
$33,000
Interest Rate
5.82%
Mortgage Type
Stand Alone Second
Purchase Details
Closed on
Feb 27, 2004
Sold by
Wampler Brian J and Wampler Debra L
Bought by
Huser Timothy C and Huser Linda G
Create a Home Valuation Report for This Property
The Home Valuation Report is an in-depth analysis detailing your home's value as well as a comparison with similar homes in the area
Home Values in the Area
Average Home Value in this Area
Purchase History
| Date | Buyer | Sale Price | Title Company |
|---|---|---|---|
| Deanda Steven | $165,000 | Pacific Northwest Title Of L | |
| Huser Timothy C | $114,500 | Western Pioneer Title Co |
Source: Public Records
Mortgage History
| Date | Status | Borrower | Loan Amount |
|---|---|---|---|
| Closed | Deanda Maria | $30,000 | |
| Closed | Deanda Steven | $33,000 |
Source: Public Records
Tax History Compared to Growth
Tax History
| Year | Tax Paid | Tax Assessment Tax Assessment Total Assessment is a certain percentage of the fair market value that is determined by local assessors to be the total taxable value of land and additions on the property. | Land | Improvement |
|---|---|---|---|---|
| 2023 | $2,967 | $154,999 | $0 | $0 |
| 2022 | $2,748 | $150,485 | $0 | $0 |
| 2021 | $2,698 | $146,102 | $0 | $0 |
| 2020 | $2,619 | $141,847 | $0 | $0 |
| 2019 | $2,541 | $137,716 | $0 | $0 |
| 2018 | $2,395 | $129,811 | $0 | $0 |
| 2017 | $2,303 | $129,811 | $0 | $0 |
| 2016 | $2,255 | $126,030 | $0 | $0 |
| 2015 | $2,190 | $122,359 | $0 | $0 |
| 2014 | $2,157 | $118,795 | $0 | $0 |
Source: Public Records
Map
Nearby Homes