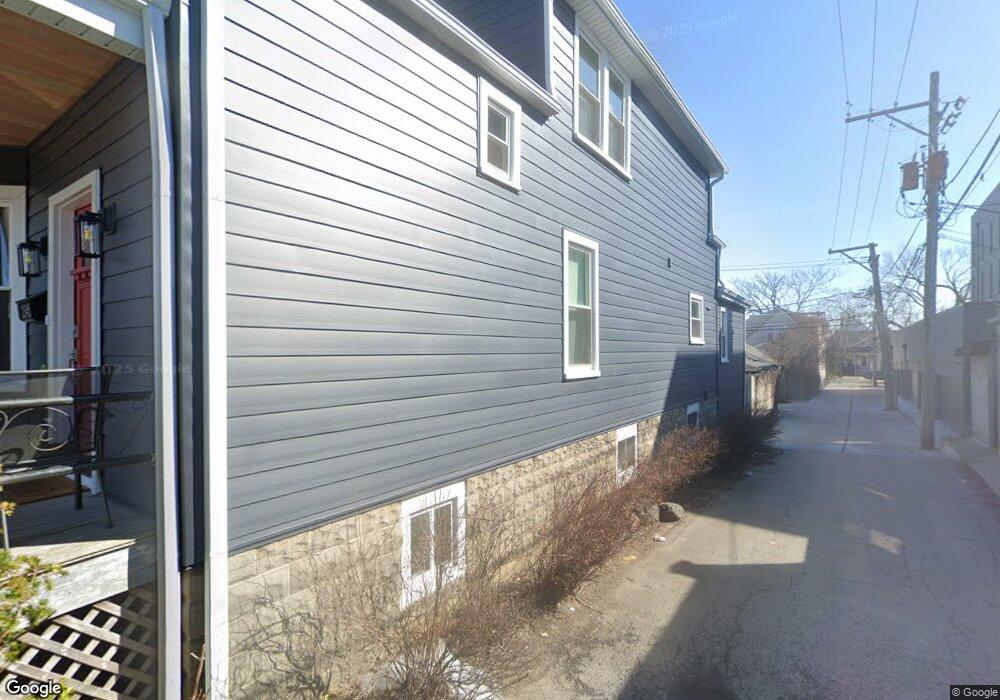
2345 W Berwyn Ave Chicago, IL 60625
Bowmanville NeighborhoodEstimated Value: $742,000 - $900,000
3
Beds
3
Baths
1,938
Sq Ft
$430/Sq Ft
Est. Value
About This Home
This home is located at 2345 W Berwyn Ave, Chicago, IL 60625 and is currently estimated at $832,686, approximately $429 per square foot. 2345 W Berwyn Ave is a home located in Cook County with nearby schools including Chappell Elementary School, Amundsen High School, and St. Philip Lutheran School.
Ownership History
Date
Name
Owned For
Owner Type
Purchase Details
Closed on
Jun 22, 2009
Sold by
Sullivan Kathleen
Bought by
Festa John and Festa Elizabeth
Current Estimated Value
Home Financials for this Owner
Home Financials are based on the most recent Mortgage that was taken out on this home.
Original Mortgage
$363,375
Outstanding Balance
$230,698
Interest Rate
4.86%
Mortgage Type
Unknown
Estimated Equity
$601,988
Purchase Details
Closed on
Jun 21, 2009
Sold by
Hlavac Karol
Bought by
Sullivan Kathleen and Estate Of Thomas A Griffin
Home Financials for this Owner
Home Financials are based on the most recent Mortgage that was taken out on this home.
Original Mortgage
$363,375
Outstanding Balance
$230,698
Interest Rate
4.86%
Mortgage Type
Unknown
Estimated Equity
$601,988
Purchase Details
Closed on
Mar 26, 2002
Sold by
Lasalle Bank National Assn
Bought by
Griffin Thomas A
Home Financials for this Owner
Home Financials are based on the most recent Mortgage that was taken out on this home.
Original Mortgage
$80,000
Interest Rate
7.24%
Create a Home Valuation Report for This Property
The Home Valuation Report is an in-depth analysis detailing your home's value as well as a comparison with similar homes in the area
Home Values in the Area
Average Home Value in this Area
Purchase History
| Date | Buyer | Sale Price | Title Company |
|---|---|---|---|
| Festa John | $427,500 | None Available | |
| Sullivan Kathleen | -- | Affinity Title Services Llc | |
| Griffin Thomas A | -- | Chicago Title Insurance Co |
Source: Public Records
Mortgage History
| Date | Status | Borrower | Loan Amount |
|---|---|---|---|
| Open | Festa John | $363,375 | |
| Previous Owner | Griffin Thomas A | $80,000 |
Source: Public Records
Tax History Compared to Growth
Tax History
| Year | Tax Paid | Tax Assessment Tax Assessment Total Assessment is a certain percentage of the fair market value that is determined by local assessors to be the total taxable value of land and additions on the property. | Land | Improvement |
|---|---|---|---|---|
| 2024 | $12,945 | $77,001 | $37,313 | $39,688 |
| 2023 | $12,598 | $64,671 | $30,000 | $34,671 |
| 2022 | $12,598 | $64,671 | $30,000 | $34,671 |
| 2021 | $12,335 | $64,671 | $30,000 | $34,671 |
| 2020 | $12,131 | $57,557 | $15,750 | $41,807 |
| 2019 | $12,019 | $63,250 | $15,750 | $47,500 |
| 2018 | $11,815 | $63,250 | $15,750 | $47,500 |
| 2017 | $10,343 | $51,422 | $13,500 | $37,922 |
| 2016 | $9,799 | $51,422 | $13,500 | $37,922 |
| 2015 | $8,942 | $51,422 | $13,500 | $37,922 |
| 2014 | $7,455 | $42,750 | $9,750 | $33,000 |
| 2013 | $7,297 | $42,750 | $9,750 | $33,000 |
Source: Public Records
Map
Nearby Homes
- 2420 W Farragut Ave Unit 3A
- 2422 W Berwyn Ave Unit 309
- 2434 W Farragut Ave Unit 3B
- 2416 W Foster Ave Unit 2S
- 2444 W Berwyn Ave Unit 1N
- 2409 W Balmoral Ave Unit 3D
- 2250 W Foster Ave Unit 2E
- 2307 W Foster Ave Unit 3
- 2307 W Foster Ave Unit 2
- 2307 W Foster Ave Unit 1
- 2411 W Balmoral Ave Unit 1F
- 5230 N Campbell Ave Unit 1B
- 2352 W Winona St Unit 3E
- 2457 W Foster Ave Unit 1
- 2461 W Foster Ave Unit 2E
- 2463 W Foster Ave Unit 3
- 5426 N Western Ave
- 5423 N Artesian Ave
- 5250 N Lincoln Ave Unit 3C
- 5300 N Lincoln Ave Unit 4E
- 2341 W Berwyn Ave
- 2339 W Berwyn Ave
- 5245 N Western Ave
- 2335 W Berwyn Ave
- 2333 W Berwyn Ave
- 2344 W Farragut Ave
- 2340 W Farragut Ave
- 2329 W Berwyn Ave
- 2338 W Farragut Ave
- 2334 W Farragut Ave
- 2334 W Farragut Ave
- 2327 W Berwyn Ave
- 2330 W Farragut Ave
- 2328 W Farragut Ave
- 2323 W Berwyn Ave
- 2321 W Berwyn Ave
- 2354 W Farragut Ave Unit 302
- 2354 W Farragut Ave Unit 306
- 2354 W Farragut Ave Unit 204
- 2354 W Farragut Ave Unit 405