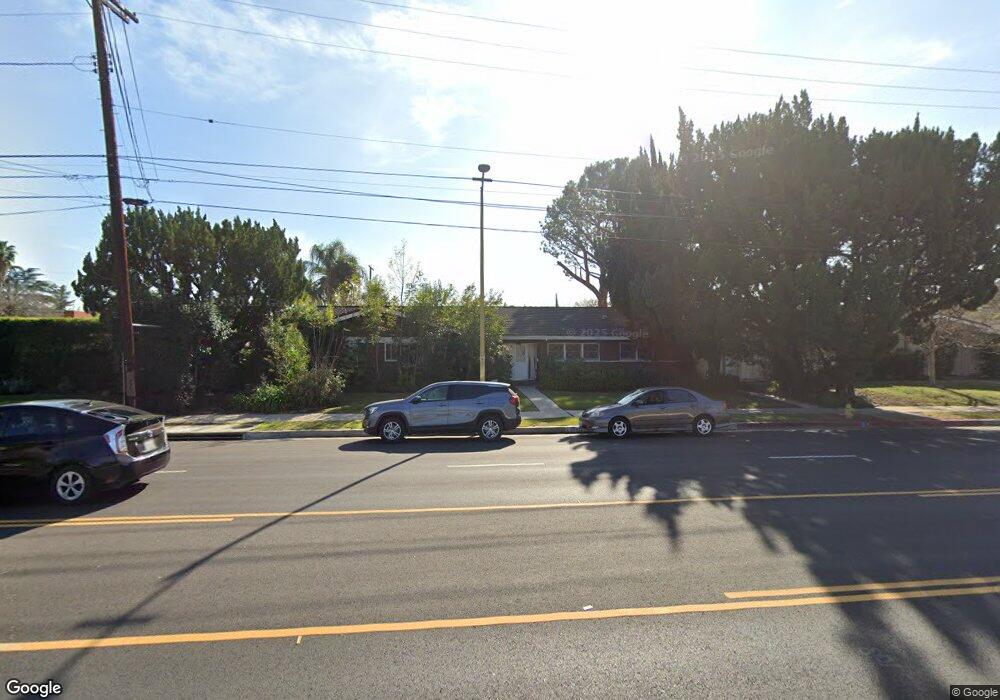
23452 Burbank Blvd Woodland Hills, CA 91367
Estimated Value: $1,419,268 - $1,612,000
3
Beds
3
Baths
2,120
Sq Ft
$707/Sq Ft
Est. Value
About This Home
This home is located at 23452 Burbank Blvd, Woodland Hills, CA 91367 and is currently estimated at $1,499,567, approximately $707 per square foot. 23452 Burbank Blvd is a home located in Los Angeles County with nearby schools including Woodlake Elementary Community Charter, Lockhurst Drive Charter Elementary, and Hale Charter Academy.
Ownership History
Date
Name
Owned For
Owner Type
Purchase Details
Closed on
Jul 27, 2018
Sold by
Shabbooi Nima
Bought by
Shabbooi Nima and Liel Irrevocable Family Trust
Current Estimated Value
Purchase Details
Closed on
Dec 29, 2009
Sold by
Robkin Michael Brian
Bought by
Shabbooi Dalia
Purchase Details
Closed on
Dec 28, 2009
Sold by
H O D Properties Llc
Bought by
Shabbooi Dalia
Purchase Details
Closed on
Nov 21, 2005
Sold by
Gillespie Cynthia A and Gillespie Bill L
Bought by
Hod Properties Llc
Purchase Details
Closed on
Aug 9, 2005
Sold by
Gillespie Cynthia Ann
Bought by
Gillespie Cynthia A and Bill L Gillespie & Cynthia A Gillespie T
Purchase Details
Closed on
Apr 12, 2005
Sold by
Turner Troy Lee and Turner Edna Mae
Bought by
Gillespie Bill L
Purchase Details
Closed on
Nov 5, 2004
Sold by
Turner Troy Lee and Turner Edna Mae
Bought by
Gillespie Bill L
Create a Home Valuation Report for This Property
The Home Valuation Report is an in-depth analysis detailing your home's value as well as a comparison with similar homes in the area
Home Values in the Area
Average Home Value in this Area
Purchase History
| Date | Buyer | Sale Price | Title Company |
|---|---|---|---|
| Shabbooi Nima | -- | None Available | |
| Shabbooi Dalia | -- | Usa Title Company | |
| Shabbooi Dalia | $490,000 | Usa Title Company | |
| Hod Properties Llc | $755,000 | Fidelity National Title | |
| Gillespie Cynthia A | -- | -- | |
| Gillespie Cynthia Ann | -- | -- | |
| Gillespie Bill L | -- | -- | |
| Gillespie Bill L | -- | -- | |
| Turner Troy Lee | -- | -- | |
| Gillespie Bill L | -- | -- |
Source: Public Records
Tax History Compared to Growth
Tax History
| Year | Tax Paid | Tax Assessment Tax Assessment Total Assessment is a certain percentage of the fair market value that is determined by local assessors to be the total taxable value of land and additions on the property. | Land | Improvement |
|---|---|---|---|---|
| 2025 | $7,827 | $632,486 | $370,457 | $262,029 |
| 2024 | $7,827 | $620,086 | $363,194 | $256,892 |
| 2023 | $7,679 | $607,928 | $356,073 | $251,855 |
| 2022 | $7,330 | $596,009 | $349,092 | $246,917 |
| 2021 | $7,234 | $584,324 | $342,248 | $242,076 |
| 2020 | $7,386 | $578,333 | $338,739 | $239,594 |
| 2019 | $7,103 | $566,995 | $332,098 | $234,897 |
| 2018 | $6,978 | $555,879 | $325,587 | $230,292 |
| 2016 | $6,662 | $534,295 | $312,945 | $221,350 |
| 2015 | $6,567 | $526,271 | $308,245 | $218,026 |
| 2014 | $6,595 | $515,963 | $302,207 | $213,756 |
Source: Public Records
Map
Nearby Homes
- 23442 Burbank Blvd
- 23346 Collins St
- 23340 Collins St
- 5622 Le Sage Ave
- 23242 Burbank Blvd
- 23357 Hatteras St
- 23236 Hatteras St
- 23701 Clarendon St
- 23416 Califa St
- 23143 Dolorosa St
- 23721 Mariano St
- 23717 Crosson Dr
- 23246 Canzonet St
- 23248 Canzonet St
- 23623 Ladrillo St
- 23245 Gonzales Dr
- 23853 Hatteras St
- 5320 Orrville Ave
- 6001 Manton Ave
- 23116 Califa St
- 23500 Burbank Blvd
- 23451 Berdon St
- 23434 Burbank Blvd
- 23501 Berdon St
- 23510 Burbank Blvd
- 23435 Berdon St
- 23426 Burbank Blvd
- 23427 Berdon St
- 23465 Burbank Blvd
- 23453 Burbank Blvd
- 23519 Berdon St
- 23501 Burbank Blvd
- 23452 Berdon St
- 23418 Burbank Blvd
- 23443 Burbank Blvd
- 23442 Berdon St
- 23500 Berdon St
- 23419 Berdon St
- 23515 Burbank Blvd