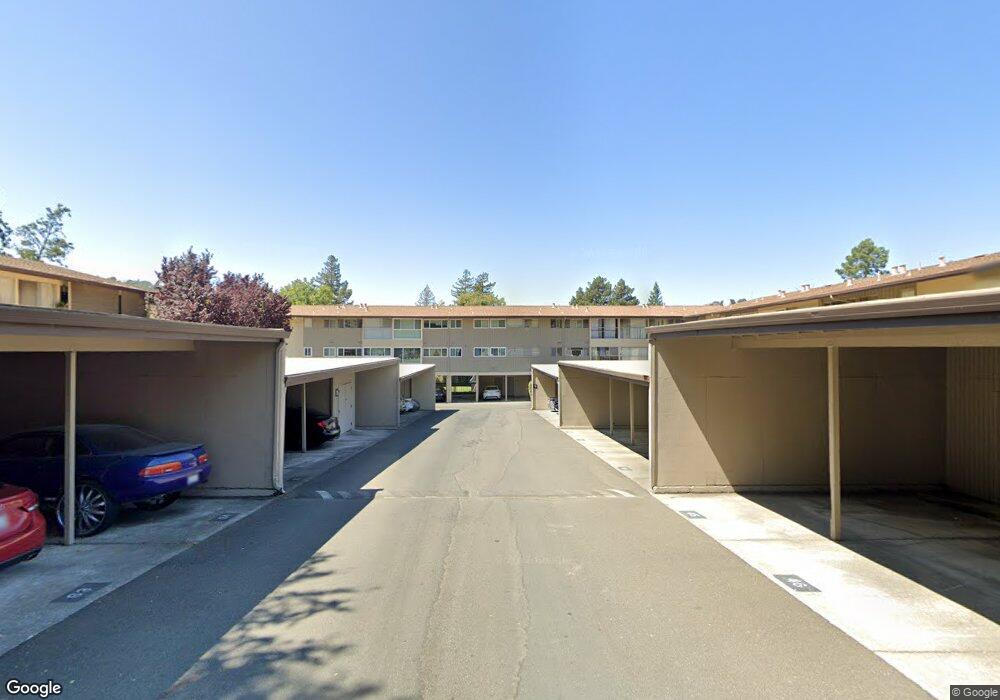
2346 Paloma Ct Unit 8 Pinole, CA 94564
Pinole Valley NeighborhoodEstimated Value: $341,000 - $366,348
3
Beds
2
Baths
1,059
Sq Ft
$334/Sq Ft
Est. Value
About This Home
This home is located at 2346 Paloma Ct Unit 8, Pinole, CA 94564 and is currently estimated at $353,337, approximately $333 per square foot. 2346 Paloma Ct Unit 8 is a home located in Contra Costa County with nearby schools including Stewart Elementary School, Pinole Middle School, and Pinole Valley High School.
Ownership History
Date
Name
Owned For
Owner Type
Purchase Details
Closed on
Jun 6, 2013
Sold by
Gutierrez Monica
Bought by
Wong Kwok Hung
Current Estimated Value
Purchase Details
Closed on
Jan 15, 2013
Sold by
Rios Raymond
Bought by
Gutierrez Monica
Purchase Details
Closed on
Oct 21, 2007
Sold by
Gutierrez Monica
Bought by
Rios Raymond
Purchase Details
Closed on
Jul 29, 2002
Sold by
Elliott Shauna Karyn
Bought by
Gutierrez Monica
Home Financials for this Owner
Home Financials are based on the most recent Mortgage that was taken out on this home.
Original Mortgage
$193,500
Interest Rate
6.5%
Mortgage Type
Purchase Money Mortgage
Purchase Details
Closed on
Dec 5, 1996
Sold by
Lynn Shepherd Mitchell
Bought by
Elliott Shauna Karyn
Home Financials for this Owner
Home Financials are based on the most recent Mortgage that was taken out on this home.
Original Mortgage
$62,391
Interest Rate
7.76%
Mortgage Type
Purchase Money Mortgage
Create a Home Valuation Report for This Property
The Home Valuation Report is an in-depth analysis detailing your home's value as well as a comparison with similar homes in the area
Home Values in the Area
Average Home Value in this Area
Purchase History
| Date | Buyer | Sale Price | Title Company |
|---|---|---|---|
| Wong Kwok Hung | $110,000 | Chicago Title Company | |
| Gutierrez Monica | -- | None Available | |
| Rios Raymond | -- | None Available | |
| Gutierrez Monica | $193,500 | Commonwealth Land Title Co | |
| Elliott Shauna Karyn | $66,000 | American Title Ins Co |
Source: Public Records
Mortgage History
| Date | Status | Borrower | Loan Amount |
|---|---|---|---|
| Previous Owner | Gutierrez Monica | $193,500 | |
| Previous Owner | Elliott Shauna Karyn | $62,391 |
Source: Public Records
Tax History Compared to Growth
Tax History
| Year | Tax Paid | Tax Assessment Tax Assessment Total Assessment is a certain percentage of the fair market value that is determined by local assessors to be the total taxable value of land and additions on the property. | Land | Improvement |
|---|---|---|---|---|
| 2025 | $2,674 | $135,443 | $49,250 | $86,193 |
| 2024 | $2,671 | $132,788 | $48,285 | $84,503 |
| 2023 | $2,671 | $130,186 | $47,339 | $82,847 |
| 2022 | $2,654 | $127,634 | $46,411 | $81,223 |
| 2021 | $2,634 | $125,132 | $45,501 | $79,631 |
| 2019 | $2,494 | $121,422 | $44,152 | $77,270 |
| 2018 | $2,421 | $119,042 | $43,287 | $75,755 |
| 2017 | $2,478 | $116,709 | $42,439 | $74,270 |
| 2016 | $2,438 | $114,421 | $41,607 | $72,814 |
| 2015 | $2,422 | $112,704 | $40,983 | $71,721 |
| 2014 | $2,427 | $110,498 | $40,181 | $70,317 |
Source: Public Records
Map
Nearby Homes
- 2940 Estates Ave Unit 7
- 2412 Alamo St
- 2464 Alamo St
- 1989 Shea Dr
- 2180 Shea Dr
- 2312 Granada Ct
- 209 N Rancho Place
- 1651 Michael Dr
- 3300 Pinole Valley Rd
- 2525 Brandt Ct
- 2615 Henry Ave
- 2420 Tomar Ct
- 2634 Emma Dr
- 2728 Terry Ct
- 266 Scotts Valley
- 2585 Moraga Dr
- 145 Glenwood
- 948 Jones Ave
- 157 Eagle Ct
- 1703 Dalessi Dr
- 2346 Paloma Ct Unit 30
- 2346 Paloma Ct Unit 4
- 2346 Paloma Ct Unit 7
- 2346 Paloma Ct Unit 3
- 2346 Paloma Ct Unit 6
- 2346 Paloma Ct Unit 2
- 2346 Paloma Ct Unit 5
- 2346 Paloma Ct Unit 1
- 2354 Paloma Ct
- 2940 Estates Ave
- 2950 Estates Ave
- 2950 Estates Ave Unit 1
- 2950 Estates Ave Unit 2
- 2950 Estates Ave Unit 6
- 2950 Estates Ave Unit 3
- 2950 Estates Ave Unit 7
- 2950 Estates Ave Unit 4
- 2950 Estates Ave Unit 8
- 2950 Estates Ave Unit 5
- 2920 Estates Ave Unit 8