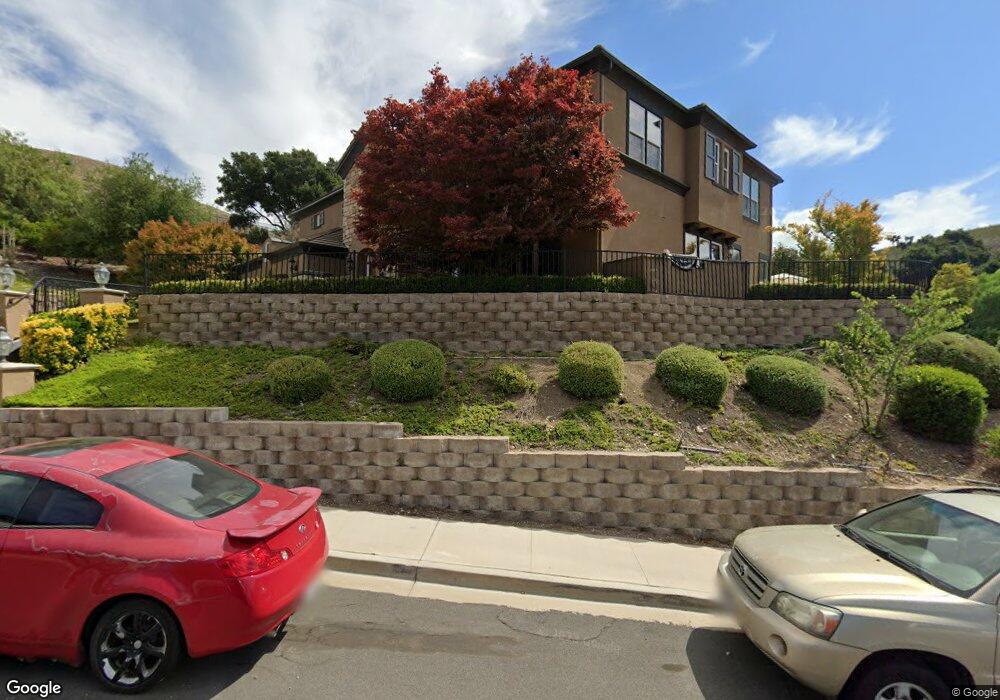
2348 Mountain Crest Cir Thousand Oaks, CA 91362
Estimated Value: $1,428,000 - $2,620,000
4
Beds
4
Baths
3,957
Sq Ft
$541/Sq Ft
Est. Value
About This Home
This home is located at 2348 Mountain Crest Cir, Thousand Oaks, CA 91362 and is currently estimated at $2,141,417, approximately $541 per square foot. 2348 Mountain Crest Cir is a home located in Ventura County with nearby schools including Conejo Elementary School, Colina Middle School, and Westlake High School.
Ownership History
Date
Name
Owned For
Owner Type
Purchase Details
Closed on
Apr 26, 2021
Sold by
Hong Dae H and Hong Connie A
Bought by
Hong Dae H and Hong Connie A
Current Estimated Value
Purchase Details
Closed on
Oct 17, 2002
Sold by
Csr Llc
Bought by
Hong Dae E and Hong Connie A
Home Financials for this Owner
Home Financials are based on the most recent Mortgage that was taken out on this home.
Original Mortgage
$628,292
Interest Rate
5.12%
Create a Home Valuation Report for This Property
The Home Valuation Report is an in-depth analysis detailing your home's value as well as a comparison with similar homes in the area
Purchase History
We collect this data history from publicly available records. To have your information removed, we recommend requesting removal directly through your county’s website.
| Date | Buyer | Sale Price | Title Company |
|---|---|---|---|
| Hong Dae H | -- | Timios Title A Ca Corp | |
| Hong Dae E | -- | Chicago Title |
Source: Public Records
Mortgage History
We collect this data history from publicly available records. To have your information removed, we recommend requesting removal directly through your county’s website.
| Date | Status | Borrower | Loan Amount |
|---|---|---|---|
| Previous Owner | Hong Dae E | $628,292 | |
| Closed | Hong Dae E | $78,500 |
Source: Public Records
Tax History
| Year | Tax Paid | Tax Assessment Tax Assessment Total Assessment is a certain percentage of the fair market value that is determined by local assessors to be the total taxable value of land and additions on the property. | Land | Improvement |
|---|---|---|---|---|
| 2025 | $12,922 | $1,201,990 | $568,721 | $633,269 |
| 2024 | $12,922 | $1,178,422 | $557,570 | $620,852 |
| 2023 | $11,995 | $1,100,535 | $546,637 | $553,898 |
| 2022 | $11,721 | $1,072,989 | $535,919 | $537,070 |
| 2021 | $11,490 | $1,049,027 | $525,411 | $523,616 |
| 2020 | $9,925 | $936,937 | $520,024 | $416,913 |
| 2019 | $9,249 | $878,829 | $509,829 | $369,000 |
| 2018 | $11,087 | $1,056,395 | $499,832 | $556,563 |
| 2017 | $10,871 | $1,035,682 | $490,032 | $545,650 |
| 2016 | $10,768 | $1,015,375 | $480,424 | $534,951 |
| 2015 | $10,580 | $1,000,124 | $473,208 | $526,916 |
| 2014 | $10,430 | $980,536 | $463,940 | $516,596 |
Source: Public Records
Map
Nearby Homes
- 491 Twin Oaks Ct
- 327 Wynn Ct
- 367 Westlake Vista Ln
- 315 E Toyon Ct
- 378 Westlake Vista Ln
- 327 Toyon Ct
- 2471 La Granada Dr
- 332 E Hilltop Way
- 2399 Chiquita Ln
- 2193 Los Feliz Dr Unit 6
- 2457 Chiquita Ln
- 603 Lone Oak Dr
- 2486 Pleasant Way Unit H
- 2456 Pleasant Way Unit A
- 863 Falmouth St
- 3091 E Hillcrest Dr
- 2402 Pleasant Way Unit H
- 110 Jeranios Ct
- 1745 Los Feliz Dr Unit 12
- 1631 Charterwood Ct
- 490 Rye Ct
- 482 Rye Ct
- 499 Rye Ct
- 474 Rye Ct
- 466 Rye Ct
- 2342 Mountain Crest Cir
- 2345 Mountain Crest Cir
- 2349 Mountain Crest Cir
- 2338 Mountain Crest Cir
- 2352 Mountain Crest
- 2352 Mountain Crest Cir
- 2333 Mountain Crest Cir
- 2341 Mountain Crest Cir
- 2334 Mountain Crest Cir
- 2337 Mountain Crest Cir
- 2353 Mountain Crest Cir
- 2329 Mountain Crest Cir
- 590 N Conejo School Rd
- 2330 Mountain Crest Cir
- 2325 Mountain Crest Cir
Your Personal Tour Guide
Ask me questions while you tour the home.