2348 Valwood Ave El Monte, CA 91732
Mountain View NeighborhoodEstimated payment $9,469/month
About This Home
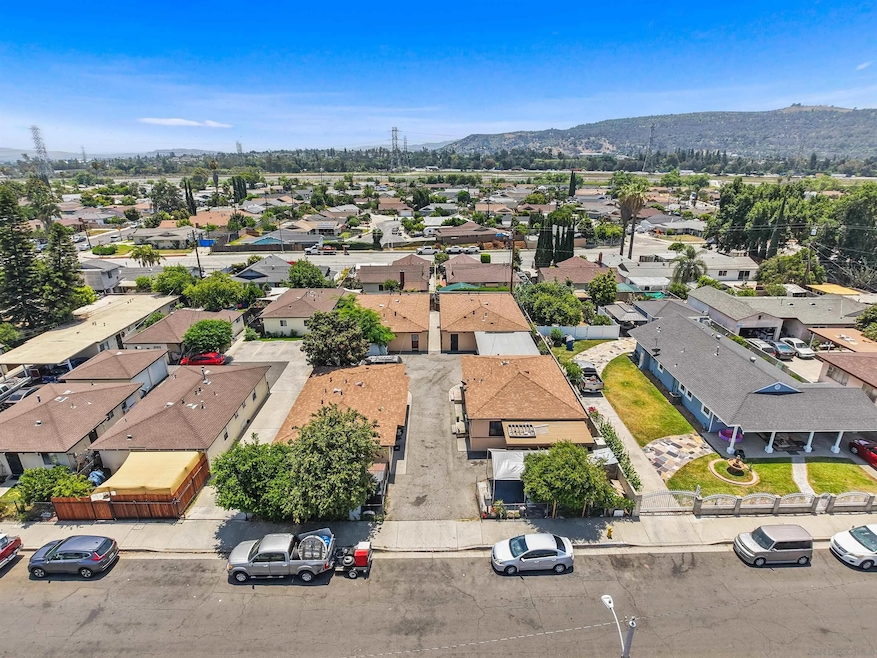
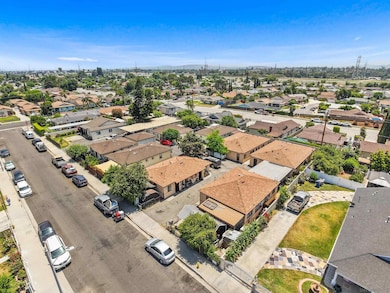
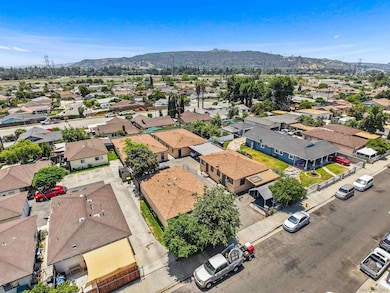
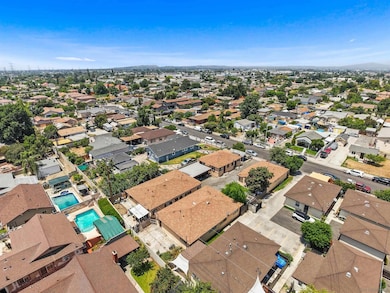
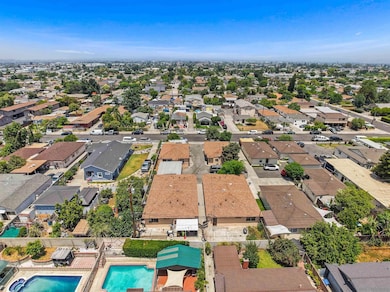
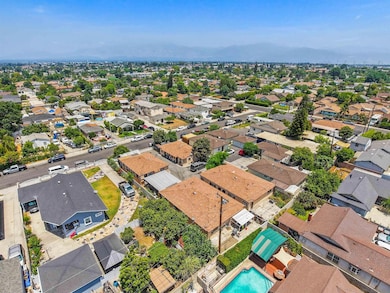
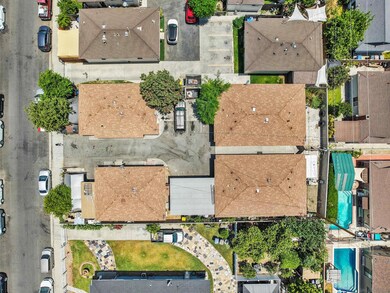
Exceptional 8-Unit Multi-Family Investment in El Monte. This outstanding 8-unit multi-family property presents a rare investment opportunity across four separate duplex buildings. Four 2 bed/1 bath units, and four 1 bed/1 bath units. Each of the eight units offers comfortable living and ample natural light, appealing to a wide range of tenants. Great upside potential with projected estimated market rents for 2-bedroom units are around $2,040/month and 1-bedroom units about $1,620/month. There's significant value-add potential through cosmetic upgrades or exploring ADU additions. Its prime location ensures easy access to major freeways, public transportation, diverse dining, shopping centers, parks, and schools. This property offers a compelling investment with significant upside. Don't miss your chance to acquire this income-generating property in a thriving Southern California community. Contact us today for details and a private showing!
Property Details
Home Type
- Multi-Family
Est. Annual Taxes
- $6,171
Home Design
Additional Features
- 1-Story Property
- 0.28 Acre Lot
Community Details
Overview
- 4 Buildings
- 8 Units
Building Details
- Operating Expense $18,787
Map
Home Values in the Area
Average Home Value in this Area
Tax History
| Year | Tax Paid | Tax Assessment Tax Assessment Total Assessment is a certain percentage of the fair market value that is determined by local assessors to be the total taxable value of land and additions on the property. | Land | Improvement |
|---|---|---|---|---|
| 2025 | $6,171 | $1,476,800 | $716,400 | $760,400 |
| 2024 | $6,171 | $286,888 | $57,227 | $229,661 |
| 2023 | $6,087 | $281,263 | $56,105 | $225,158 |
| 2022 | $5,910 | $275,749 | $55,005 | $220,744 |
| 2021 | $5,957 | $270,343 | $53,927 | $216,416 |
| 2019 | $5,818 | $262,327 | $52,329 | $209,998 |
| 2018 | $5,492 | $257,184 | $51,303 | $205,881 |
| 2016 | $5,070 | $247,200 | $49,312 | $197,888 |
| 2015 | $5,013 | $243,488 | $48,572 | $194,916 |
| 2014 | $4,974 | $238,719 | $47,621 | $191,098 |
Property History
| Date | Event | Price | List to Sale | Price per Sq Ft |
|---|---|---|---|---|
| 11/13/2025 11/13/25 | Pending | -- | -- | -- |
| 11/03/2025 11/03/25 | Price Changed | $1,699,000 | -5.6% | -- |
| 09/15/2025 09/15/25 | Price Changed | $1,800,000 | -10.0% | -- |
| 06/27/2025 06/27/25 | For Sale | $1,999,000 | -- | -- |
Purchase History
| Date | Type | Sale Price | Title Company |
|---|---|---|---|
| Interfamily Deed Transfer | -- | None Available |
Source: San Diego MLS
MLS Number: 250031917
APN: 8108-024-033
Disclaimer: Certain information contained herein is derived from information provided by parties other than Homes.com. All information provided is deemed reliable, but is not guaranteed to be accurate and should be independently verified.
![]() This information is deemed reliable but not guaranteed. You should rely on this information only to decide whether or not to further investigate a particular property.
This information is deemed reliable but not guaranteed. You should rely on this information only to decide whether or not to further investigate a particular property.
BEFORE MAKING ANY OTHER DECISION, YOU SHOULD PERSONALLY INVESTIGATE THE FACTS (e.g. square footage and lot size) with the assistance of an appropriate professional. You may use this information only to identify properties you may be interested in investigating further. All uses except for personal, noncommercial use in accordance with the foregoing purpose are prohibited. Redistribution or copying of this information, any photographs or video tours is strictly
prohibited. This information is derived from the Internet Data Exchange (IDX) service provided by San Diego MLS. Displayed property listings may be held by a brokerage firm other than the broker and/or agent responsible for this display. The information and any photographs and video tours and the compilation from which they are derived is protected by copyright. Compilation © 2025 San Diego MLS.
- 2361 Parkway Dr
- 2306 Burkett Rd
- 2237 Delnice Ave
- 12536 Fineview St
- 12465 Fineview St
- 2251 Bryce Rd
- 12700 Elliott Ave Unit 286
- 12700 Elliott Ave Unit 456
- 12700 Elliott Ave Unit 71
- 12700 Elliott Ave Unit 80
- 12700 Elliott Ave Unit 292
- 12700 Elliott Ave Unit 35
- 12700 Elliott Ave Unit 10
- 12700 Elliott Ave Unit 406
- 12700 Elliott Ave Unit 219
- 12700 Elliott Ave Unit 119
- 12700 Elliott Ave Unit 87
- 12700 Elliott Ave Unit 492
- 12700 Elliott Ave
- 12700 Elliott Ave Unit 438
