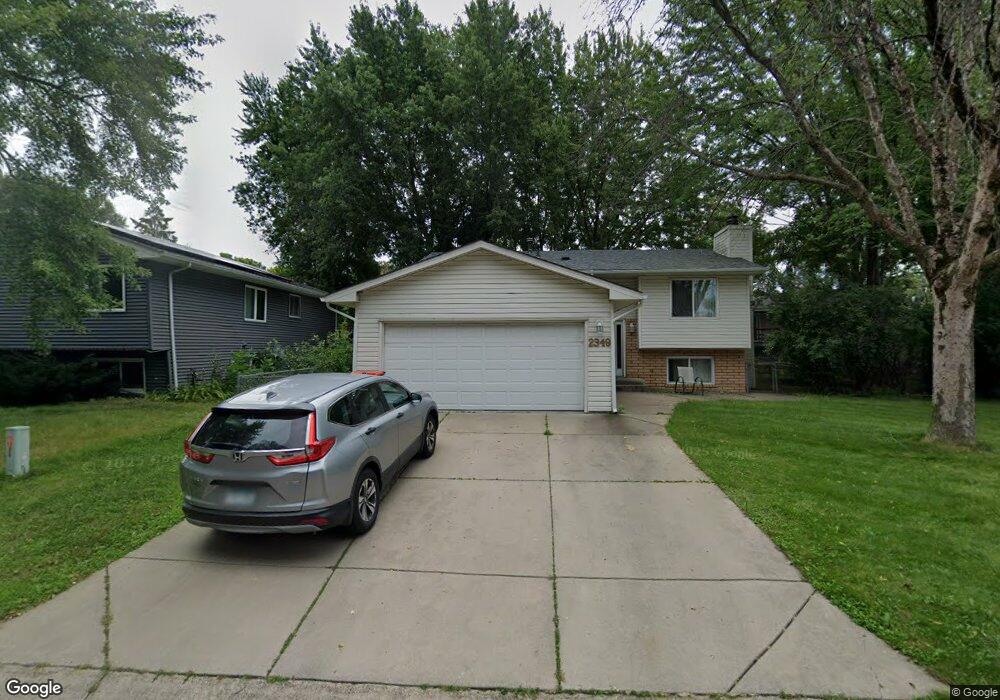
2349 Cascade Plaza S Woodbury, MN 55125
Estimated Value: $331,000 - $349,680
4
Beds
2
Baths
980
Sq Ft
$350/Sq Ft
Est. Value
About This Home
This home is located at 2349 Cascade Plaza S, Woodbury, MN 55125 and is currently estimated at $342,670, approximately $349 per square foot. 2349 Cascade Plaza S is a home located in Washington County with nearby schools including Royal Oaks Elementary School, Woodbury Middle School, and Woodbury Senior High School.
Ownership History
Date
Name
Owned For
Owner Type
Purchase Details
Closed on
May 28, 2020
Sold by
Grundhauser Corey A and Trudell Ashley
Bought by
Mohamed Abdirizak O and Malin Hoden A
Current Estimated Value
Home Financials for this Owner
Home Financials are based on the most recent Mortgage that was taken out on this home.
Original Mortgage
$250,200
Outstanding Balance
$222,197
Interest Rate
3.3%
Mortgage Type
New Conventional
Estimated Equity
$120,473
Purchase Details
Closed on
May 1, 2018
Sold by
Bandholz Gerald M and Bandholz Deborah J
Bought by
Bandholz Deborah J and Bandholz Gerald M
Purchase Details
Closed on
Nov 5, 2014
Sold by
Cannedy Harld and Cannedy Janet
Bought by
Grundhauser Corey A
Purchase Details
Closed on
Mar 18, 2004
Sold by
Grand Hauser Karl C
Bought by
Cannedy Janet and Cannedy Harold
Purchase Details
Closed on
Dec 1, 1999
Sold by
Carlson Christopher L and Carlson Kristine L
Bought by
Cannedy Harold L and Cannedy Janet
Create a Home Valuation Report for This Property
The Home Valuation Report is an in-depth analysis detailing your home's value as well as a comparison with similar homes in the area
Home Values in the Area
Average Home Value in this Area
Purchase History
| Date | Buyer | Sale Price | Title Company |
|---|---|---|---|
| Mohamed Abdirizak O | $278,000 | Edina Realty Title Inc | |
| Bandholz Deborah J | -- | None Available | |
| Grundhauser Corey A | $225,000 | Watermark Title Agency | |
| Cannedy Janet | $225,000 | -- | |
| Cannedy Harold L | $148,600 | -- |
Source: Public Records
Mortgage History
| Date | Status | Borrower | Loan Amount |
|---|---|---|---|
| Open | Mohamed Abdirizak O | $250,200 |
Source: Public Records
Tax History Compared to Growth
Tax History
| Year | Tax Paid | Tax Assessment Tax Assessment Total Assessment is a certain percentage of the fair market value that is determined by local assessors to be the total taxable value of land and additions on the property. | Land | Improvement |
|---|---|---|---|---|
| 2024 | $3,672 | $312,200 | $80,000 | $232,200 |
| 2023 | $3,672 | $357,100 | $127,500 | $229,600 |
| 2022 | $3,396 | $314,800 | $102,000 | $212,800 |
| 2021 | $3,152 | $262,400 | $85,000 | $177,400 |
| 2020 | $3,284 | $247,700 | $92,500 | $155,200 |
| 2019 | $3,174 | $240,700 | $82,500 | $158,200 |
| 2018 | $3,558 | $224,700 | $80,000 | $144,700 |
| 2017 | $2,816 | $208,800 | $72,500 | $136,300 |
| 2016 | $3,034 | $199,900 | $65,000 | $134,900 |
| 2015 | $2,654 | $186,600 | $50,000 | $136,600 |
| 2013 | -- | $164,000 | $45,300 | $118,700 |
Source: Public Records
Map
Nearby Homes
- 7765 Havenwood Cir
- 7731 Highpointe Rd
- 2522 Windsor Ln
- 7825 Rimbley Rd
- 7557 Springbrook Plaza
- 7674 Dunmore Rd
- 7481 Columbia Ct
- 7618 Dunmore Rd
- 7834 Dunmore Rd
- 7782 Rimbley Rd
- 7664 Steepleview Rd
- 8155 Boulder Ridge Rd
- 2415 Timberlea Dr
- 1873 Bielenberg Dr
- 2297 Timberlea Dr
- 7582 Ojibway Park Rd
- 2755 Meadow Brook Dr Unit F
- 7132 Glenross Rd
- 7965 Forest Blvd Unit C
- 2781 Robinwood Way
- 2341 Cascade Plaza S
- 2357 Cascade Plaza S
- 2348 Cascade Plaza S
- 2365 Cascade Plaza S
- 2356 Cascade Plaza S
- 2356 2356 Cascade-Plaza-s
- 2333 Cascade Plaza S
- 2333 2333 Cascade-Plaza-s
- 2340 Cascade Plaza S
- 2374 Windsor Ln
- 2388 Windsor Ln
- 2364 Cascade Plaza S
- 2332 Cascade Plaza S
- 2329 Cascade Plaza S
- 2362 Windsor Ln
- 2373 Cascade Plaza S
- 2373 2373 Cascade-Plaza-s
- 2372 Cascade Plaza S
- 2372 2372 Cascade-Plaza-s
- 2402 Windsor Ln