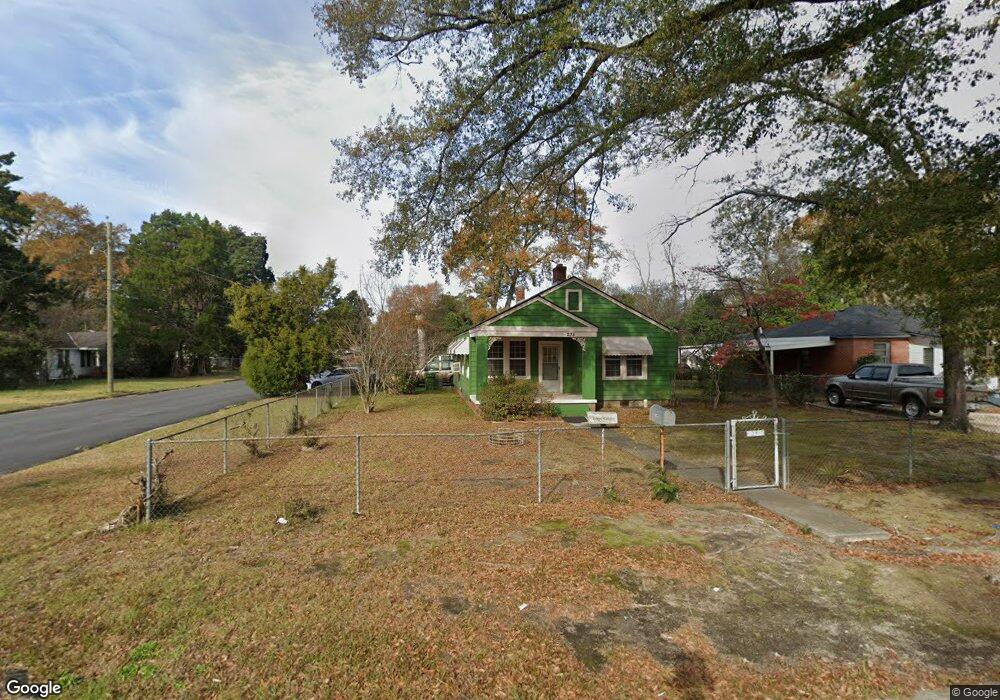
235 28th Ave Columbus, GA 31903
Southern Columbus NeighborhoodEstimated Value: $46,000 - $75,000
2
Beds
2
Baths
1,018
Sq Ft
$57/Sq Ft
Est. Value
About This Home
This home is located at 235 28th Ave, Columbus, GA 31903 and is currently estimated at $57,753, approximately $56 per square foot. 235 28th Ave is a home located in Muscogee County with nearby schools including Martin Luther King Jr. Elementary School, Baker Middle School, and Carver High School.
Create a Home Valuation Report for This Property
The Home Valuation Report is an in-depth analysis detailing your home's value as well as a comparison with similar homes in the area
Home Values in the Area
Average Home Value in this Area
Tax History Compared to Growth
Tax History
| Year | Tax Paid | Tax Assessment Tax Assessment Total Assessment is a certain percentage of the fair market value that is determined by local assessors to be the total taxable value of land and additions on the property. | Land | Improvement |
|---|---|---|---|---|
| 2025 | $78 | $18,452 | $3,036 | $15,416 |
| 2024 | -- | $18,652 | $3,236 | $15,416 |
| 2023 | $13 | $18,652 | $3,236 | $15,416 |
| 2022 | $80 | $14,836 | $3,236 | $11,600 |
| 2021 | $73 | $14,200 | $3,236 | $10,964 |
| 2020 | $73 | $14,200 | $3,236 | $10,964 |
| 2019 | $75 | $14,200 | $3,236 | $10,964 |
| 2018 | $75 | $14,200 | $3,236 | $10,964 |
| 2017 | $77 | $14,200 | $3,236 | $10,964 |
| 2016 | $79 | $15,187 | $2,129 | $13,058 |
| 2015 | $80 | $15,187 | $2,129 | $13,058 |
| 2014 | $80 | $15,187 | $2,129 | $13,058 |
| 2013 | -- | $15,187 | $2,129 | $13,058 |
Source: Public Records
Map
Nearby Homes