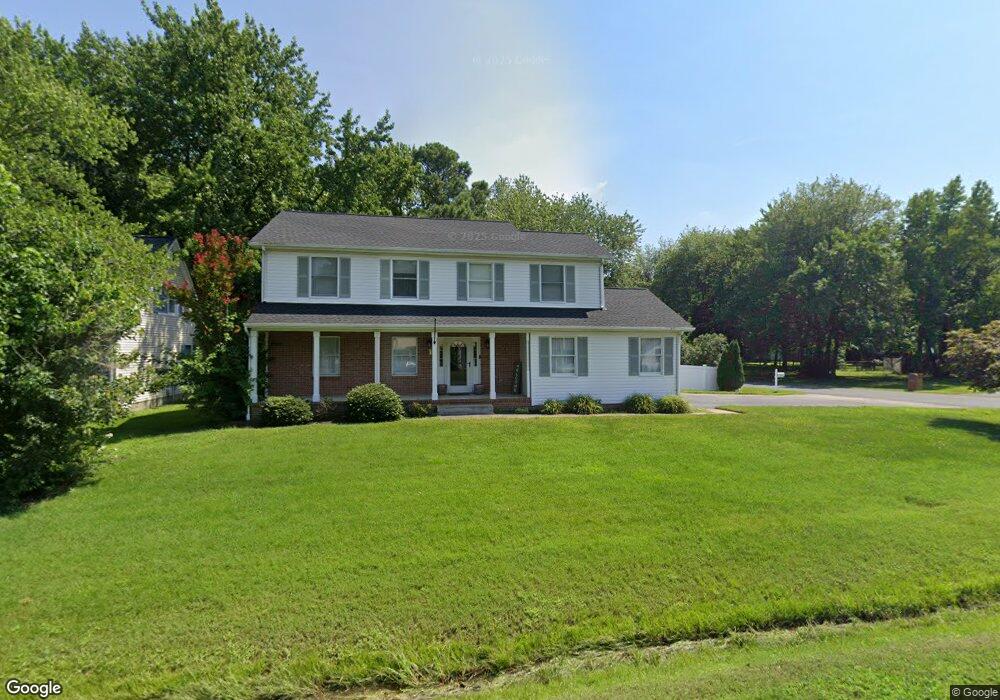
235 Ackerman Rd Stevensville, MD 21666
Estimated Value: $472,000 - $527,000
Studio
3
Baths
1,720
Sq Ft
$290/Sq Ft
Est. Value
About This Home
This home is located at 235 Ackerman Rd, Stevensville, MD 21666 and is currently estimated at $499,029, approximately $290 per square foot. 235 Ackerman Rd is a home located in Queen Anne's County with nearby schools including Kent Island Elementary School, Bayside Elementary School, and Stevensville Middle School.
Ownership History
Date
Name
Owned For
Owner Type
Purchase Details
Closed on
Mar 11, 2022
Sold by
Quante Jennifer C
Bought by
Ward Michael Anthony and Ward Jordon Brooke
Current Estimated Value
Home Financials for this Owner
Home Financials are based on the most recent Mortgage that was taken out on this home.
Original Mortgage
$475,695
Outstanding Balance
$439,184
Interest Rate
3.55%
Mortgage Type
VA
Estimated Equity
$59,845
Purchase Details
Closed on
Jun 9, 2017
Sold by
Breen John A and Breen Denise J
Bought by
Quante Patrick D and Quante Jennifer C
Home Financials for this Owner
Home Financials are based on the most recent Mortgage that was taken out on this home.
Original Mortgage
$300,800
Interest Rate
4.03%
Mortgage Type
New Conventional
Purchase Details
Closed on
Mar 27, 1996
Sold by
Countryside Builders
Bought by
Breen John A and Breen Denise J
Create a Home Valuation Report for This Property
The Home Valuation Report is an in-depth analysis detailing your home's value as well as a comparison with similar homes in the area
Home Values in the Area
Average Home Value in this Area
Purchase History
| Date | Buyer | Sale Price | Title Company |
|---|---|---|---|
| Ward Michael Anthony | $465,000 | Chicago Title | |
| Quante Patrick D | $376,000 | The Atlantic Title Group | |
| Breen John A | $149,700 | -- |
Source: Public Records
Mortgage History
| Date | Status | Borrower | Loan Amount |
|---|---|---|---|
| Open | Ward Michael Anthony | $475,695 | |
| Previous Owner | Quante Patrick D | $300,800 | |
| Closed | Breen John A | -- |
Source: Public Records
Tax History
| Year | Tax Paid | Tax Assessment Tax Assessment Total Assessment is a certain percentage of the fair market value that is determined by local assessors to be the total taxable value of land and additions on the property. | Land | Improvement |
|---|---|---|---|---|
| 2025 | $3,732 | $396,133 | $0 | $0 |
| 2024 | $3,498 | $371,367 | $0 | $0 |
| 2023 | $3,265 | $346,600 | $166,100 | $180,500 |
| 2022 | $3,265 | $346,600 | $166,100 | $180,500 |
| 2021 | $3,336 | $346,600 | $166,100 | $180,500 |
| 2020 | $3,460 | $360,800 | $181,100 | $179,700 |
| 2019 | $3,313 | $345,467 | $0 | $0 |
| 2018 | $3,166 | $330,133 | $0 | $0 |
| 2017 | $2,894 | $314,800 | $0 | $0 |
| 2016 | -- | $301,767 | $0 | $0 |
| 2015 | $2,794 | $288,733 | $0 | $0 |
| 2014 | $2,794 | $275,700 | $0 | $0 |
Source: Public Records
Map
Nearby Homes
- 808 Cloverfields Dr
- 716 Cloverfields Dr
- 704 Cloverfields Dr
- 822 Kimberly Way
- 255 Redstart Dr
- 259 Redstart Dr
- 719 Warbler Way
- 620 Old Love Point Rd
- 141 Redstart Dr
- 719 Warbler Way
- 630 Warbler Way Unit 2212
- 932 Kimberly Way
- 630 Warbler Way Unit 2224
- 630 Warbler Way Unit 2223
- 630 Warbler Way Unit 2222
- 630 Warbler Way Unit 2232
- 630 Warbler Way Unit 2233
- 630 Warbler Way Unit 2211
- 630 Warbler Way Unit 2221
- 539 Warbler Way
Your Personal Tour Guide
Ask me questions while you tour the home.