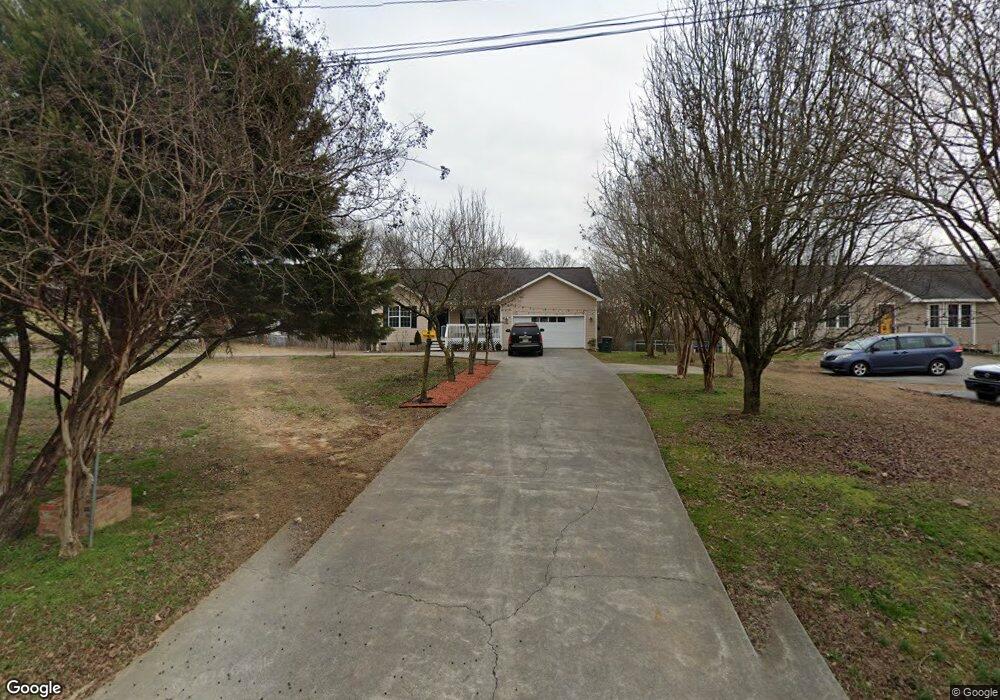
235 Cook Rd NW Calhoun, GA 30701
Estimated Value: $233,000 - $275,000
3
Beds
2
Baths
1,384
Sq Ft
$186/Sq Ft
Est. Value
About This Home
This home is located at 235 Cook Rd NW, Calhoun, GA 30701 and is currently estimated at $257,239, approximately $185 per square foot. 235 Cook Rd NW is a home located in Gordon County with nearby schools including Tolbert Elementary School, Ashworth Middle School, and Gordon Central High School.
Ownership History
Date
Name
Owned For
Owner Type
Purchase Details
Closed on
Sep 19, 2018
Sold by
Martinez Julio
Bought by
Almodova Imelda
Current Estimated Value
Purchase Details
Closed on
Jan 31, 2007
Sold by
Almodova Imelda
Bought by
Almodova Imelda and Almodova Martinez Julio
Home Financials for this Owner
Home Financials are based on the most recent Mortgage that was taken out on this home.
Original Mortgage
$99,200
Interest Rate
6.13%
Mortgage Type
New Conventional
Purchase Details
Closed on
Feb 27, 2006
Sold by
Cash Derek Jackson
Bought by
Cash Derek Jackson and Cash Kristy Carol
Home Financials for this Owner
Home Financials are based on the most recent Mortgage that was taken out on this home.
Original Mortgage
$122,459
Interest Rate
6.05%
Mortgage Type
FHA
Purchase Details
Closed on
Oct 14, 2005
Sold by
Damascus Court Llc
Bought by
Dmi Builders Inc
Purchase Details
Closed on
Jun 23, 2005
Sold by
Blackstock Callie
Bought by
Damascus Court Llc
Create a Home Valuation Report for This Property
The Home Valuation Report is an in-depth analysis detailing your home's value as well as a comparison with similar homes in the area
Home Values in the Area
Average Home Value in this Area
Purchase History
| Date | Buyer | Sale Price | Title Company |
|---|---|---|---|
| Almodova Imelda | -- | -- | |
| Almodova Imelda | -- | -- | |
| Almodova Imelda | $124,000 | -- | |
| Cash Derek Jackson | -- | -- | |
| Cash Derek Jackson | $124,400 | -- | |
| Dmi Builders Inc | -- | -- | |
| Damascus Court Llc | $55,000 | -- |
Source: Public Records
Mortgage History
| Date | Status | Borrower | Loan Amount |
|---|---|---|---|
| Previous Owner | Almodova Imelda | $99,200 | |
| Previous Owner | Almodova Imelda | $24,800 | |
| Previous Owner | Cash Derek Jackson | $122,459 |
Source: Public Records
Tax History Compared to Growth
Tax History
| Year | Tax Paid | Tax Assessment Tax Assessment Total Assessment is a certain percentage of the fair market value that is determined by local assessors to be the total taxable value of land and additions on the property. | Land | Improvement |
|---|---|---|---|---|
| 2024 | $1,760 | $71,280 | $5,240 | $66,040 |
| 2023 | $1,642 | $66,640 | $5,240 | $61,400 |
| 2022 | $1,628 | $62,280 | $5,240 | $57,040 |
| 2021 | $1,393 | $51,720 | $5,240 | $46,480 |
| 2020 | $1,439 | $52,240 | $5,240 | $47,000 |
| 2019 | $1,447 | $52,240 | $5,240 | $47,000 |
| 2018 | $1,334 | $48,320 | $5,240 | $43,080 |
| 2017 | $1,299 | $45,840 | $5,240 | $40,600 |
| 2016 | $1,302 | $45,840 | $5,240 | $40,600 |
| 2015 | $1,290 | $45,040 | $5,240 | $39,800 |
| 2014 | $1,195 | $43,045 | $5,254 | $37,791 |
Source: Public Records
Map
Nearby Homes
- 260 Goat Rd NW
- 272 Fairview Rd NW
- 376 Covey Rise Dr NW
- 400 Hall Memorial Rd NW
- 0 Hall Memorial Rd NW Unit 9595
- 0 Sugar Valley Rd NW Unit 7635696
- 0 Sugar Valley Rd NW Unit 10588110
- 135 Russell Hill Rd NW
- 00 Hall Memorial Rd
- 157 Chance Dr NW
- 803 Riverside Dr
- 742 Riverside Dr
- 156 Cooper Ln
- 146 Causby Ln NW
- Brexley Manor Townhomes Floor Plan at Brexley Manor - Townhomes
- 2796 U S 41
- Spruce Plan at Riverside at Calhoun
- Cedar Plan at Riverside at Calhoun
- Birch Plan at Riverside at Calhoun
- Hazel Plan at Riverside at Calhoun
- 221 Cook Rd NW
- 216 Cook Rd NW
- 207 Cook Rd NW
- 200 Cook Rd NW
- 193 Cook Rd NW
- 179 Cook Rd NW
- 182 Cook Rd NW
- 165 Cook Rd NW
- 156 Cook Rd NW
- 153 Cook Rd NW
- 0 Cook Rd NW Unit 10031378
- 0 Cook Rd NW Unit 7159217
- 0 Cook Rd NW
- 144 Cook Rd NW
- 132 Cook Rd NW
- 327 Cook Rd NW
- 230 Cook Rd NW
- 337 Fairview Rd NW
- 361 Fairview Rd NW
- 303 Fairview Rd NW