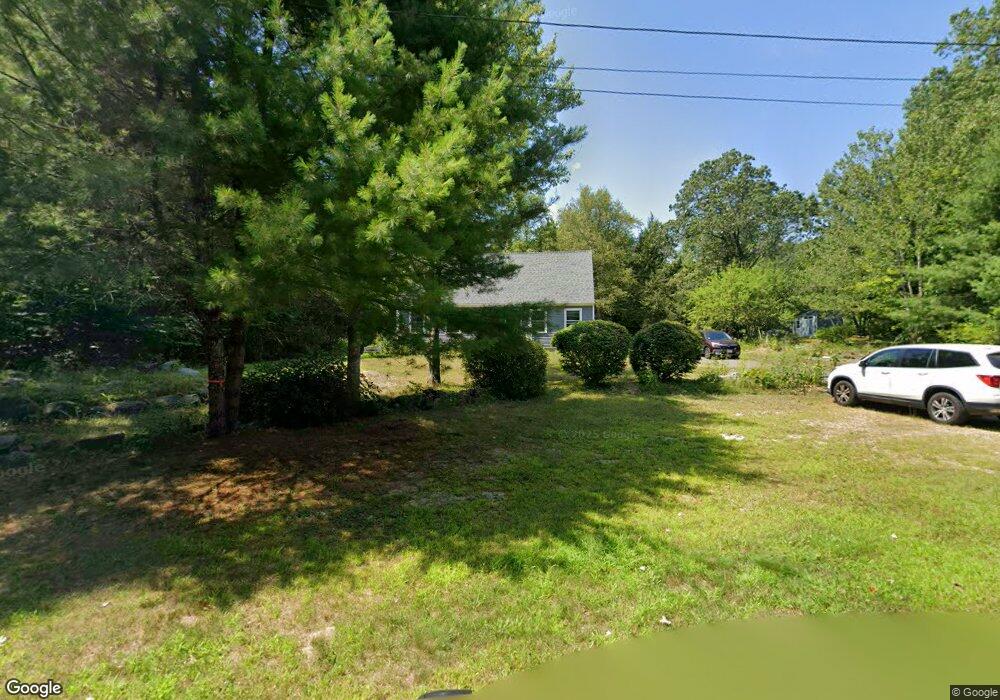
235 Dana Rd Orange, MA 01364
Estimated Value: $384,000 - $501,000
4
Beds
2
Baths
1,808
Sq Ft
$244/Sq Ft
Est. Value
About This Home
This home is located at 235 Dana Rd, Orange, MA 01364 and is currently estimated at $440,605, approximately $243 per square foot. 235 Dana Rd is a home located in Franklin County with nearby schools including Fisher Hill and Ralph C Mahar Regional School.
Ownership History
Date
Name
Owned For
Owner Type
Purchase Details
Closed on
Nov 2, 2005
Sold by
Reloc Cendant Mobility
Bought by
Bull Maria M and Garrity Steven M
Current Estimated Value
Home Financials for this Owner
Home Financials are based on the most recent Mortgage that was taken out on this home.
Original Mortgage
$210,000
Outstanding Balance
$113,723
Interest Rate
5.85%
Mortgage Type
Purchase Money Mortgage
Estimated Equity
$326,882
Purchase Details
Closed on
Jun 8, 2000
Sold by
Pulley Peter M and Pulley Ellen D
Bought by
Tietjen Richard A and Andrew Tietjen R
Home Financials for this Owner
Home Financials are based on the most recent Mortgage that was taken out on this home.
Original Mortgage
$84,750
Interest Rate
8.12%
Mortgage Type
Purchase Money Mortgage
Create a Home Valuation Report for This Property
The Home Valuation Report is an in-depth analysis detailing your home's value as well as a comparison with similar homes in the area
Home Values in the Area
Average Home Value in this Area
Purchase History
| Date | Buyer | Sale Price | Title Company |
|---|---|---|---|
| Bull Maria M | $210,000 | -- | |
| Reloc Cendant Mobility | $220,000 | -- | |
| Tietjen Richard A | $113,000 | -- |
Source: Public Records
Mortgage History
| Date | Status | Borrower | Loan Amount |
|---|---|---|---|
| Open | Bull Maria M | $210,000 | |
| Previous Owner | Tietjen Richard A | $13,700 | |
| Previous Owner | Tietjen Richard A | $84,750 | |
| Previous Owner | Tietjen Richard A | $89,100 | |
| Closed | Tietjen Richard A | $28,250 |
Source: Public Records
Tax History Compared to Growth
Tax History
| Year | Tax Paid | Tax Assessment Tax Assessment Total Assessment is a certain percentage of the fair market value that is determined by local assessors to be the total taxable value of land and additions on the property. | Land | Improvement |
|---|---|---|---|---|
| 2025 | $6,830 | $415,200 | $40,000 | $375,200 |
| 2024 | $5,307 | $304,300 | $40,000 | $264,300 |
| 2023 | $4,452 | $247,900 | $40,000 | $207,900 |
| 2022 | $4,583 | $239,700 | $40,000 | $199,700 |
| 2021 | $4,229 | $210,900 | $61,400 | $149,500 |
| 2020 | $4,247 | $208,900 | $60,900 | $148,000 |
| 2019 | $4,076 | $181,000 | $54,600 | $126,400 |
| 2018 | $3,925 | $178,900 | $53,800 | $125,100 |
| 2017 | $3,798 | $178,900 | $53,800 | $125,100 |
| 2016 | $3,665 | $168,900 | $53,800 | $115,100 |
| 2015 | $3,529 | $169,900 | $53,800 | $116,100 |
| 2014 | $3,407 | $172,600 | $53,800 | $118,800 |
Source: Public Records
Map
Nearby Homes