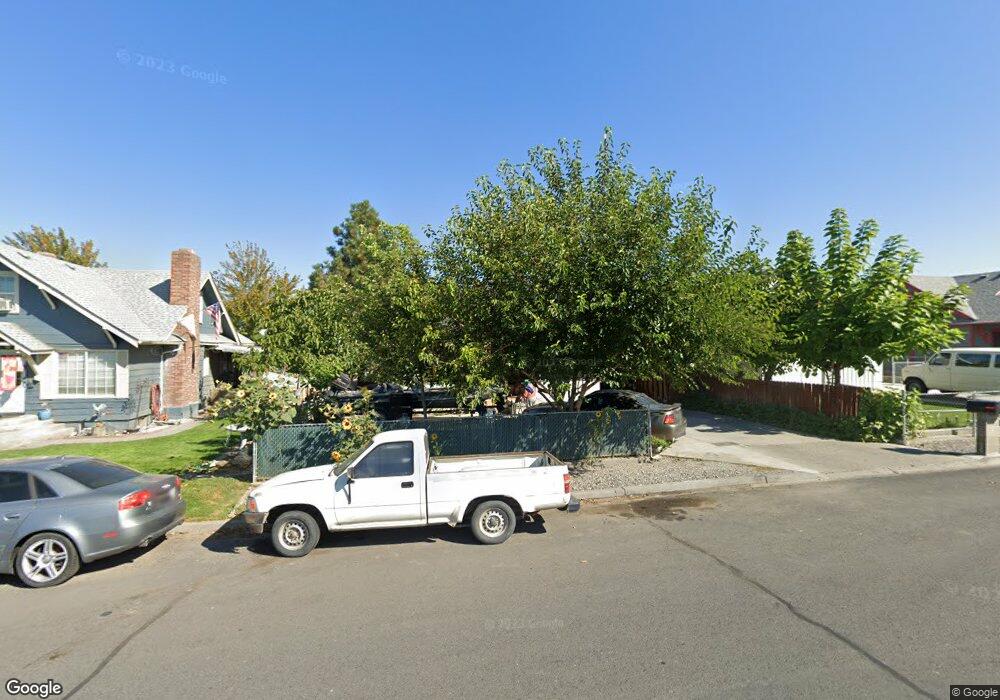
235 E Cedar St Othello, WA 99344
Estimated Value: $166,000 - $253,000
2
Beds
1
Bath
825
Sq Ft
$234/Sq Ft
Est. Value
About This Home
This home is located at 235 E Cedar St, Othello, WA 99344 and is currently estimated at $193,008, approximately $233 per square foot. 235 E Cedar St is a home located in Adams County with nearby schools including Othello High School and Liberty Bell Academy.
Ownership History
Date
Name
Owned For
Owner Type
Purchase Details
Closed on
Sep 28, 2006
Sold by
Leary Richard Daniel and Leary Jean
Bought by
Ramirez Jesus and Ramirez Anastacia
Current Estimated Value
Home Financials for this Owner
Home Financials are based on the most recent Mortgage that was taken out on this home.
Original Mortgage
$45,000
Interest Rate
6%
Mortgage Type
Seller Take Back
Purchase Details
Closed on
Sep 26, 2006
Sold by
Leary Richard Daniel and Leary Jean
Bought by
Ramirez Jesus and Ramirez Anastacia
Home Financials for this Owner
Home Financials are based on the most recent Mortgage that was taken out on this home.
Original Mortgage
$45,000
Interest Rate
6%
Mortgage Type
Seller Take Back
Purchase Details
Closed on
Sep 15, 2006
Sold by
Bennison Catherine C
Bought by
Leary Richard Daniel and Leary Jean
Home Financials for this Owner
Home Financials are based on the most recent Mortgage that was taken out on this home.
Original Mortgage
$45,000
Interest Rate
6%
Mortgage Type
Seller Take Back
Create a Home Valuation Report for This Property
The Home Valuation Report is an in-depth analysis detailing your home's value as well as a comparison with similar homes in the area
Purchase History
| Date | Buyer | Sale Price | Title Company |
|---|---|---|---|
| Ramirez Jesus | $60,000 | Ctic Ritzville | |
| Ramirez Jesus | $60,000 | Chicago Title Insurance Co | |
| Leary Richard Daniel | $40,000 | Ctic Ritzville |
Source: Public Records
Mortgage History
| Date | Status | Borrower | Loan Amount |
|---|---|---|---|
| Previous Owner | Ramirez Jesus | $45,000 |
Source: Public Records
Tax History
| Year | Tax Paid | Tax Assessment Tax Assessment Total Assessment is a certain percentage of the fair market value that is determined by local assessors to be the total taxable value of land and additions on the property. | Land | Improvement |
|---|---|---|---|---|
| 2024 | $1,406 | $123,800 | $39,200 | $84,600 |
| 2023 | $1,406 | $114,200 | $36,300 | $77,900 |
| 2022 | $1,292 | $96,800 | $29,100 | $67,700 |
| 2021 | $1,278 | $96,800 | $29,100 | $67,700 |
| 2020 | $1,155 | $91,700 | $29,100 | $62,600 |
| 2019 | $988 | $86,600 | $29,100 | $57,500 |
| 2018 | $988 | $73,900 | $21,000 | $52,900 |
| 2017 | $987 | $73,900 | $21,000 | $52,900 |
Source: Public Records
Map
Nearby Homes
- 205 E Cedar St
- 245 E Cedar St
- 425 N Desdemona Ave
- 620 N Larkspur Ln
- 550 E Olympia St
- 1295 S 7th Ave
- 705 E Mt Adams St
- 415 Sylvan Dr
- 1105 E Olympia St
- 1205 E Rainier St
- 1120 E Mt Adams St
- 1070 S 4th Ave
- 980 Capstone Ave
- 1209 E Mt Hood St
- 1124 E Mt Hood St
- 1144 E Mt Hood St
- 925 S 11th Ave
- 1224 E Mt Hood St
- 1259 E Mt Hood St
- 1171 E Mt Hood St
Your Personal Tour Guide
Ask me questions while you tour the home.