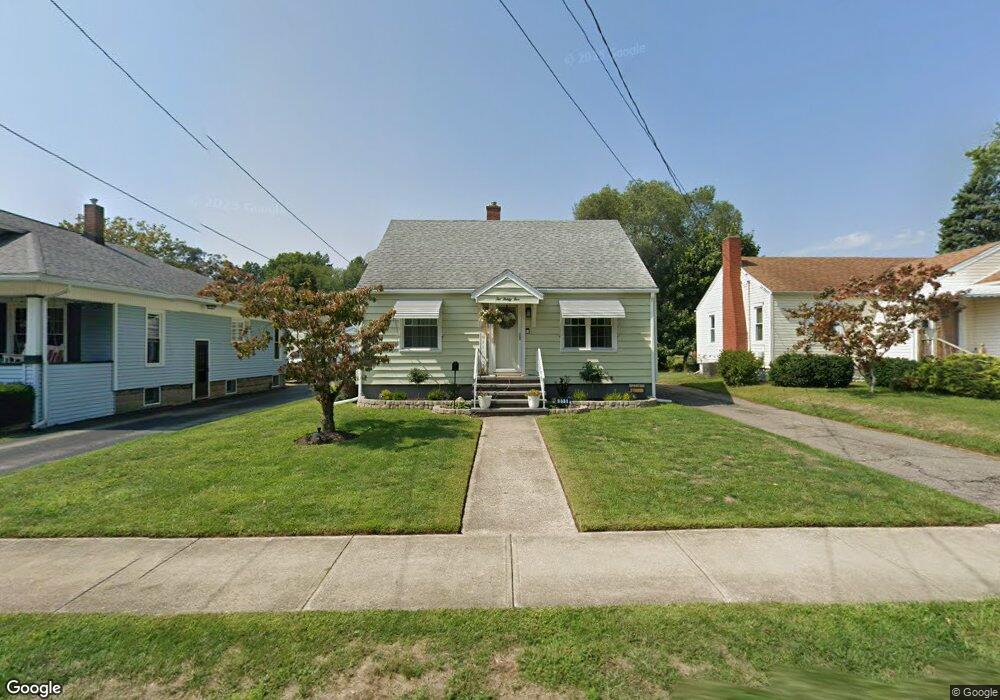
235 Fifield Ave Conneaut, OH 44030
Estimated Value: $146,000 - $161,000
3
Beds
1
Bath
1,176
Sq Ft
$130/Sq Ft
Est. Value
About This Home
This home is located at 235 Fifield Ave, Conneaut, OH 44030 and is currently estimated at $152,973, approximately $130 per square foot. 235 Fifield Ave is a home located in Ashtabula County with nearby schools including Lakeshore Primary Elementary School, Gateway Elementary School, and Conneaut Middle School.
Ownership History
Date
Name
Owned For
Owner Type
Purchase Details
Closed on
Oct 25, 2024
Sold by
Kristie Lea Properties Ii Llc
Bought by
Pew Tyler Stafford and Pew Tatum
Current Estimated Value
Home Financials for this Owner
Home Financials are based on the most recent Mortgage that was taken out on this home.
Original Mortgage
$147,440
Outstanding Balance
$145,964
Interest Rate
6.09%
Mortgage Type
Credit Line Revolving
Estimated Equity
$7,009
Purchase Details
Closed on
Mar 13, 2024
Sold by
Ashtabula County
Bought by
Kristie Lea Properties Ii Llc
Purchase Details
Closed on
Mar 30, 2011
Sold by
Siders Christine M
Bought by
Adang Thomas
Home Financials for this Owner
Home Financials are based on the most recent Mortgage that was taken out on this home.
Original Mortgage
$65,171
Interest Rate
5.04%
Mortgage Type
VA
Create a Home Valuation Report for This Property
The Home Valuation Report is an in-depth analysis detailing your home's value as well as a comparison with similar homes in the area
Home Values in the Area
Average Home Value in this Area
Purchase History
| Date | Buyer | Sale Price | Title Company |
|---|---|---|---|
| Pew Tyler Stafford | $147,440 | Title Professionals Group | |
| Pew Tyler Stafford | $147,440 | Title Professionals Group | |
| Kristie Lea Properties Ii Llc | $75,766 | None Listed On Document | |
| Adang Thomas | $63,800 | Chicago Title |
Source: Public Records
Mortgage History
| Date | Status | Borrower | Loan Amount |
|---|---|---|---|
| Open | Pew Tyler Stafford | $147,440 | |
| Closed | Pew Tyler Stafford | $147,440 | |
| Previous Owner | Adang Thomas | $65,171 |
Source: Public Records
Tax History
| Year | Tax Paid | Tax Assessment Tax Assessment Total Assessment is a certain percentage of the fair market value that is determined by local assessors to be the total taxable value of land and additions on the property. | Land | Improvement |
|---|---|---|---|---|
| 2024 | $2,143 | $29,300 | $4,200 | $25,100 |
| 2023 | $1,363 | $29,300 | $4,200 | $25,100 |
| 2022 | $1,155 | $21,840 | $3,220 | $18,620 |
| 2021 | $1,175 | $21,840 | $3,220 | $18,620 |
| 2020 | $1,175 | $21,840 | $3,220 | $18,620 |
| 2019 | $639 | $20,340 | $1,680 | $18,660 |
| 2018 | $610 | $20,340 | $1,680 | $18,660 |
| 2017 | $608 | $20,340 | $1,680 | $18,660 |
| 2016 | $601 | $21,290 | $1,790 | $19,500 |
| 2015 | $607 | $21,290 | $1,790 | $19,500 |
| 2014 | $535 | $21,290 | $1,790 | $19,500 |
| 2013 | $621 | $23,730 | $2,660 | $21,070 |
Source: Public Records
Map
Nearby Homes
- 855 Spring St Unit S9
- 247 Whitney St
- 238 Whitney St
- 745 Maple Ave
- 110 Edgewood Dr
- 210 W Main Rd
- 202 W Main Rd Unit 132
- 202 W Main Rd Unit 115
- 18 Hillcrest Ct
- 536 Madison St
- 474 Sherman St
- 475 State St
- 220 Daniels Ave
- VL Center Rd
- 1145 Lake Rd
- 1150 Lake Rd
- 2663 Lake Rd
- 375 Bliss Ave
- 555 Wrights Ave
- 536 Mill St
Your Personal Tour Guide
Ask me questions while you tour the home.