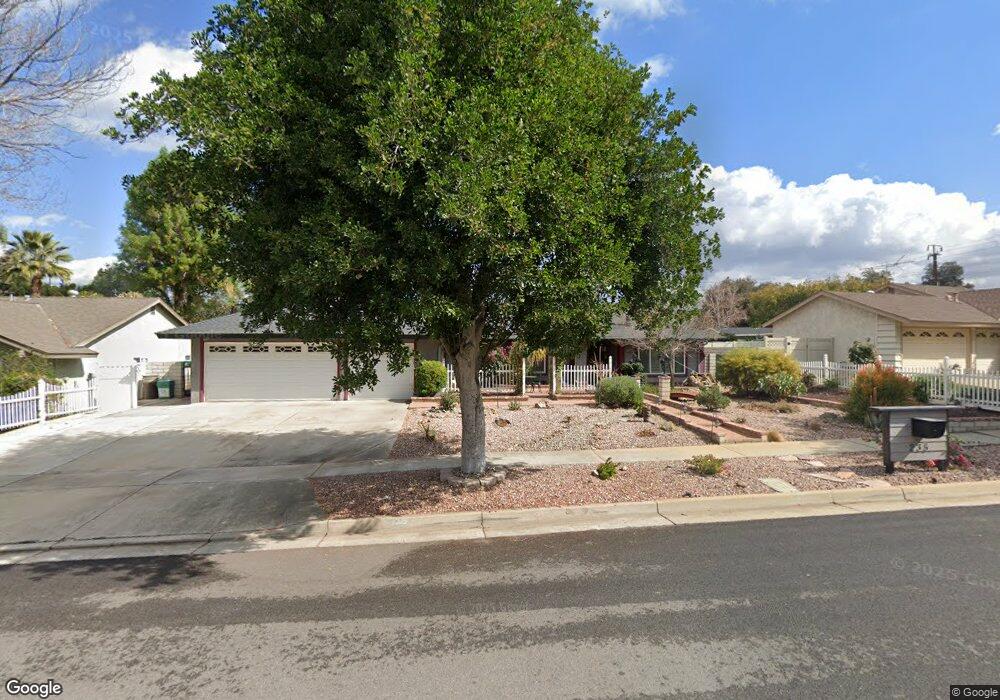
235 Fremont St Redlands, CA 92373
South Redlands NeighborhoodEstimated Value: $640,553 - $703,000
4
Beds
2
Baths
1,726
Sq Ft
$388/Sq Ft
Est. Value
About This Home
This home is located at 235 Fremont St, Redlands, CA 92373 and is currently estimated at $669,138, approximately $387 per square foot. 235 Fremont St is a home located in San Bernardino County with nearby schools including McKinley Elementary School, Cope Middle School, and Redlands Senior High School.
Ownership History
Date
Name
Owned For
Owner Type
Purchase Details
Closed on
Jun 4, 2005
Sold by
Lero Daniel J and Lero Deborah A
Bought by
Lero Daniel J and Lero Deborah A
Current Estimated Value
Purchase Details
Closed on
Apr 9, 1997
Sold by
Copeland Charles P and Copeland Arlene D
Bought by
Lero Daniel and Lero Deborah A
Home Financials for this Owner
Home Financials are based on the most recent Mortgage that was taken out on this home.
Original Mortgage
$124,200
Outstanding Balance
$16,185
Interest Rate
7.98%
Estimated Equity
$652,953
Create a Home Valuation Report for This Property
The Home Valuation Report is an in-depth analysis detailing your home's value as well as a comparison with similar homes in the area
Home Values in the Area
Average Home Value in this Area
Purchase History
| Date | Buyer | Sale Price | Title Company |
|---|---|---|---|
| Lero Daniel J | -- | -- | |
| Lero Daniel | $138,000 | First American Title Ins Co |
Source: Public Records
Mortgage History
| Date | Status | Borrower | Loan Amount |
|---|---|---|---|
| Open | Lero Daniel | $124,200 |
Source: Public Records
Tax History Compared to Growth
Tax History
| Year | Tax Paid | Tax Assessment Tax Assessment Total Assessment is a certain percentage of the fair market value that is determined by local assessors to be the total taxable value of land and additions on the property. | Land | Improvement |
|---|---|---|---|---|
| 2025 | $2,501 | $220,352 | $71,856 | $148,496 |
| 2024 | $2,501 | $216,031 | $70,447 | $145,584 |
| 2023 | $2,497 | $211,795 | $69,066 | $142,729 |
| 2022 | $2,459 | $207,642 | $67,712 | $139,930 |
| 2021 | $2,502 | $203,570 | $66,384 | $137,186 |
| 2020 | $2,464 | $201,482 | $65,703 | $135,779 |
| 2019 | $2,394 | $197,532 | $64,415 | $133,117 |
| 2018 | $2,333 | $193,659 | $63,152 | $130,507 |
| 2017 | $2,312 | $189,862 | $61,914 | $127,948 |
| 2016 | $2,285 | $186,139 | $60,700 | $125,439 |
| 2015 | $2,267 | $183,343 | $59,788 | $123,555 |
| 2014 | $2,224 | $179,752 | $58,617 | $121,135 |
Source: Public Records
Map
Nearby Homes
- 133 S San Mateo St
- 975 Brookside Ave
- 1239 Fulbright Ave
- 628 W Fern Ave
- 521 Bond St
- 325 Lakeside Ave
- 1044 W Cypress Ave
- 1110 W Cypress Ave
- 1302 San Pablo Ave
- 162 Lakeside Ave
- 230 S Buena Vista St
- 527 Nottingham Dr
- 9440 Hollie Dr
- 636 Harding Dr
- 526 Nottingham Dr
- 1324 W Fern Ave
- 87 Tennessee St Unit C
- 91 Tennessee St Unit C
- 1417 Bella Vista Crescent
- 28 N Michigan St
- 225 Fremont St
- 245 Fremont St
- 218 Nanette St
- 214 Nanette St
- 222 Nanette St
- 210 Nanette St
- 230 Fremont St
- 215 Fremont St
- 226 Nanette St
- 206 Nanette St
- 255 Fremont St
- 240 Fremont St
- 1020 Fallbrook Ave
- 230 Nanette St
- 260 Fremont St
- 1007 W Olive Ave
- 205 Fremont St
- 250 Fremont St
- 234 Nanette St
- 1030 Fallbrook Ave