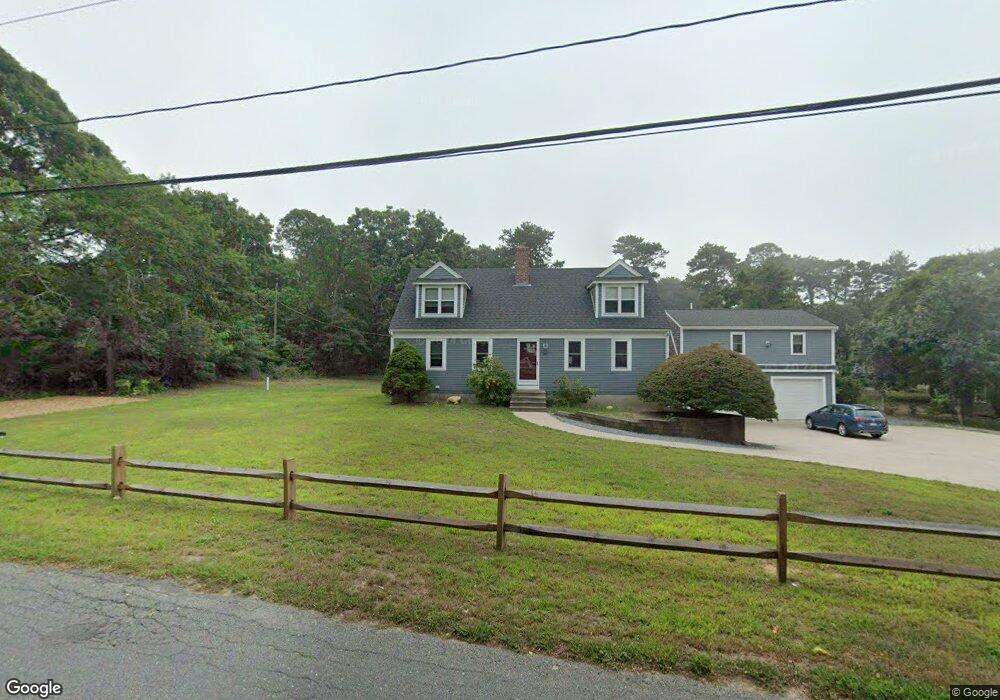
235 Hay Rd Eastham, MA 02642
Estimated Value: $825,536 - $990,000
4
Beds
3
Baths
1,993
Sq Ft
$453/Sq Ft
Est. Value
About This Home
This home is located at 235 Hay Rd, Eastham, MA 02642 and is currently estimated at $902,634, approximately $452 per square foot. 235 Hay Rd is a home located in Barnstable County with nearby schools including Eastham Elementary School, Nauset Regional Middle School, and Nauset Regional High School.
Ownership History
Date
Name
Owned For
Owner Type
Purchase Details
Closed on
Apr 20, 2018
Sold by
Zajac Breen Rt
Bought by
Zajac Frederick A and Breen Barbara F
Current Estimated Value
Purchase Details
Closed on
Apr 19, 2018
Sold by
Zajac Breen Rt
Bought by
Zajac Frederick A and Breen Barbara F
Purchase Details
Closed on
Jun 28, 1991
Sold by
Anderson Wayne R and Ksaren Anderson M
Bought by
Breen Barbara F
Home Financials for this Owner
Home Financials are based on the most recent Mortgage that was taken out on this home.
Original Mortgage
$100,000
Interest Rate
9.44%
Mortgage Type
Purchase Money Mortgage
Create a Home Valuation Report for This Property
The Home Valuation Report is an in-depth analysis detailing your home's value as well as a comparison with similar homes in the area
Home Values in the Area
Average Home Value in this Area
Purchase History
| Date | Buyer | Sale Price | Title Company |
|---|---|---|---|
| Zajac Frederick A | -- | -- | |
| Zajac Frederick A | -- | -- | |
| Breen Barbara F | $126,500 | -- |
Source: Public Records
Mortgage History
| Date | Status | Borrower | Loan Amount |
|---|---|---|---|
| Previous Owner | Breen Barbara F | $100,000 |
Source: Public Records
Tax History
| Year | Tax Paid | Tax Assessment Tax Assessment Total Assessment is a certain percentage of the fair market value that is determined by local assessors to be the total taxable value of land and additions on the property. | Land | Improvement |
|---|---|---|---|---|
| 2025 | $5,762 | $747,300 | $272,500 | $474,800 |
| 2024 | $5,096 | $726,900 | $264,600 | $462,300 |
| 2023 | $4,785 | $660,900 | $245,000 | $415,900 |
| 2022 | $4,599 | $536,000 | $218,700 | $317,300 |
| 2021 | $4,547 | $495,300 | $198,800 | $296,500 |
| 2020 | $4,245 | $486,800 | $202,900 | $283,900 |
| 2019 | $2,530 | $433,900 | $197,000 | $236,900 |
| 2018 | $3,333 | $399,200 | $191,300 | $207,900 |
| 2017 | $3,083 | $390,200 | $187,500 | $202,700 |
| 2016 | $2,876 | $386,600 | $187,500 | $199,100 |
| 2015 | $2,697 | $379,800 | $183,800 | $196,000 |
Source: Public Records
Map
Nearby Homes
- 330 Hay Rd
- 1061 State Hwy Unit 4
- 1061 State Hwy Unit 1061
- 55 Grandfathers Way
- 25 Twin Rocks Dr
- 20 Kittiwake Ln
- 60 Smith Heights Way
- 20 Stone Ct
- 320 State Hwy
- 46 Freeman Ln
- 343 Tonset Rd
- 10 Cartway N
- 40 Bayview Rd
- 2705 State Hwy
- 2705 State Hwy Unit 1-8
- 2 Reilly Run
- 181 Rock Harbor Rd
- 339 Dyer Prince Rd
- 21 Locust Rd Unit 21
- 32 Locust Rd
Your Personal Tour Guide
Ask me questions while you tour the home.