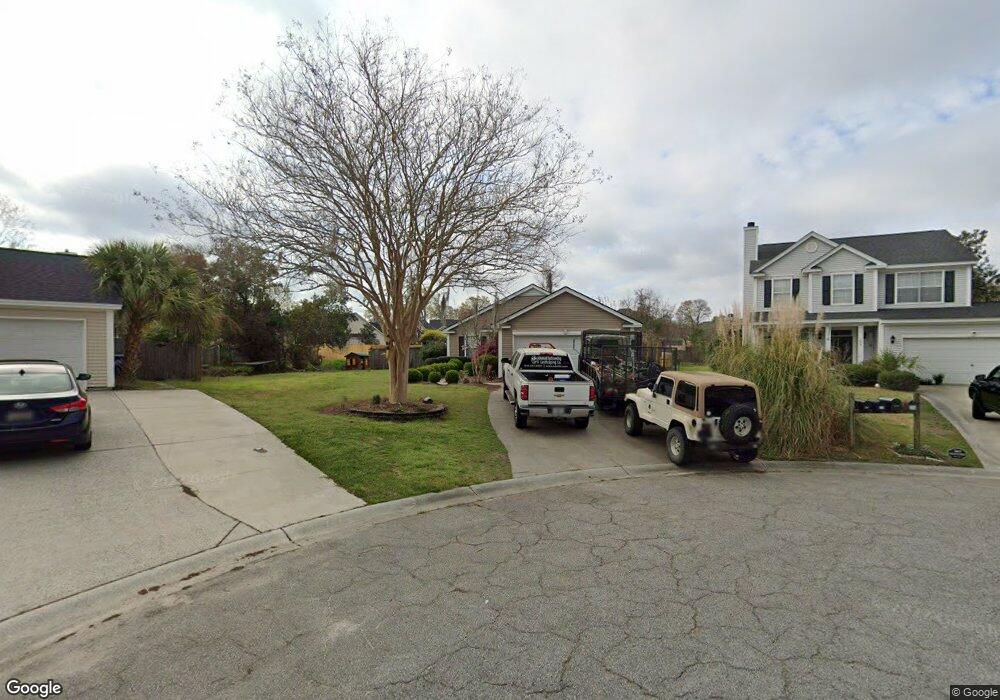
235 Lytham Ct Charleston, SC 29414
Shadowmoss NeighborhoodEstimated Value: $386,586 - $414,000
3
Beds
2
Baths
1,255
Sq Ft
$317/Sq Ft
Est. Value
About This Home
This home is located at 235 Lytham Ct, Charleston, SC 29414 and is currently estimated at $397,897, approximately $317 per square foot. 235 Lytham Ct is a home located in Charleston County with nearby schools including Drayton Hall Elementary School, West Ashley High School, and Charleston Christian School.
Ownership History
Date
Name
Owned For
Owner Type
Purchase Details
Closed on
Nov 14, 2008
Sold by
Nardi James and Nardi Carlene
Bought by
Bolt Ii Dennis M and Bolt Marie C
Current Estimated Value
Home Financials for this Owner
Home Financials are based on the most recent Mortgage that was taken out on this home.
Original Mortgage
$184,167
Outstanding Balance
$122,670
Interest Rate
6.38%
Mortgage Type
FHA
Estimated Equity
$275,227
Purchase Details
Closed on
Nov 7, 2008
Sold by
Nardi Elizabeth S
Bought by
Nardi James and Nardi Carlene
Home Financials for this Owner
Home Financials are based on the most recent Mortgage that was taken out on this home.
Original Mortgage
$184,167
Outstanding Balance
$122,670
Interest Rate
6.38%
Mortgage Type
FHA
Estimated Equity
$275,227
Purchase Details
Closed on
Oct 11, 2001
Sold by
Carlene Nardi James Nardi
Bought by
Nardi Elizabeth S
Purchase Details
Closed on
Aug 20, 1999
Sold by
Herndon Krista L
Bought by
Nardi James and Nardi Carlene
Create a Home Valuation Report for This Property
The Home Valuation Report is an in-depth analysis detailing your home's value as well as a comparison with similar homes in the area
Home Values in the Area
Average Home Value in this Area
Purchase History
| Date | Buyer | Sale Price | Title Company |
|---|---|---|---|
| Bolt Ii Dennis M | $192,000 | -- | |
| Nardi James | -- | -- | |
| Nardi Elizabeth S | -- | -- | |
| Nardi James | $121,900 | -- |
Source: Public Records
Mortgage History
| Date | Status | Borrower | Loan Amount |
|---|---|---|---|
| Open | Bolt Ii Dennis M | $184,167 |
Source: Public Records
Tax History
| Year | Tax Paid | Tax Assessment Tax Assessment Total Assessment is a certain percentage of the fair market value that is determined by local assessors to be the total taxable value of land and additions on the property. | Land | Improvement |
|---|---|---|---|---|
| 2024 | $1,409 | $8,540 | $0 | $0 |
| 2023 | $1,204 | $8,540 | $0 | $0 |
| 2022 | $1,099 | $8,540 | $0 | $0 |
| 2021 | $1,151 | $8,540 | $0 | $0 |
| 2020 | $1,191 | $8,540 | $0 | $0 |
| 2019 | $1,066 | $7,430 | $0 | $0 |
| 2017 | $1,031 | $7,430 | $0 | $0 |
| 2016 | $990 | $7,430 | $0 | $0 |
| 2015 | $1,021 | $7,430 | $0 | $0 |
| 2014 | $882 | $0 | $0 | $0 |
| 2011 | -- | $0 | $0 | $0 |
Source: Public Records
Map
Nearby Homes
- 308 Lindrick Ct
- 222 Lytham Ct
- 99 Fieldfare Way
- 190 Droos Way
- 28 Fieldfare Way
- 3354 Middleburry Ln
- 177 Briarwood Dr
- 0 Muirfield Pkwy Unit 25028940
- 3500 Forest Glen Dr
- 322 Muirfield Pkwy
- 4084 Laurelwood Dr
- 3412 Forest Glen Dr
- 4079 Laurelwood Dr
- 119 Toura Ln
- 501 Raes Ct Unit 102
- 501 Raes Ct Unit 204
- 420 Carolina Cherry Ct Unit 102
- 501 Raes Ct
- 501 Raes Ct Unit 201
- 501 Raes Ct Unit 203
Your Personal Tour Guide
Ask me questions while you tour the home.