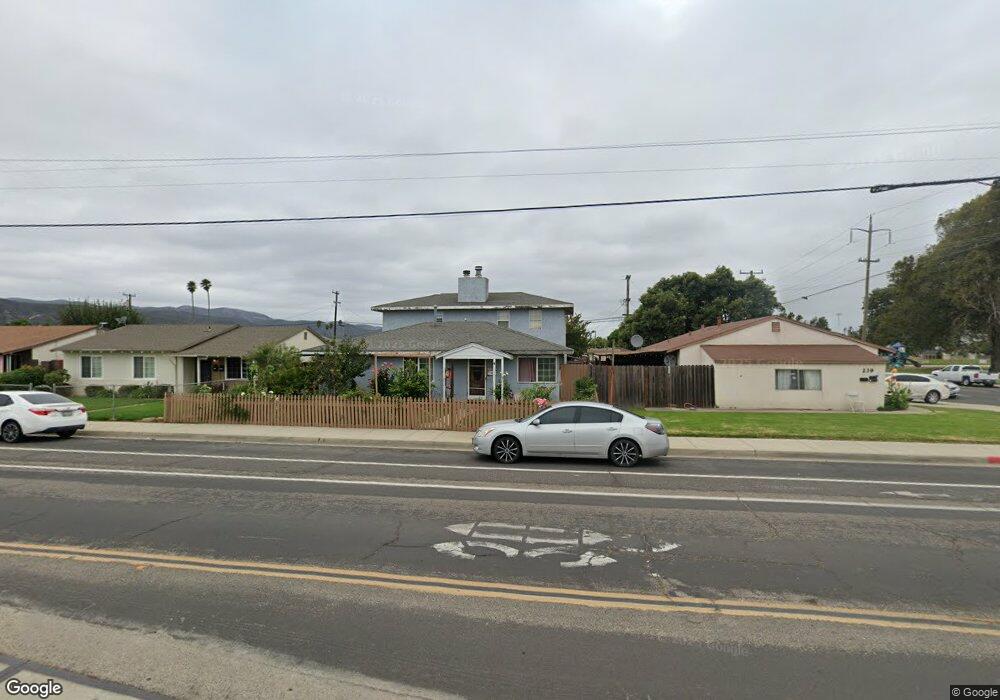
235 N A St Lompoc, CA 93436
Estimated Value: $548,000 - $670,812
4
Beds
3
Baths
2,500
Sq Ft
$243/Sq Ft
Est. Value
About This Home
This home is located at 235 N A St, Lompoc, CA 93436 and is currently estimated at $608,703, approximately $243 per square foot. 235 N A St is a home located in Santa Barbara County with nearby schools including Arthur Hapgood Elementary School, Lompoc Valley Middle School, and Lompoc High School.
Ownership History
Date
Name
Owned For
Owner Type
Purchase Details
Closed on
Jul 13, 2005
Sold by
Rios Guadalupe
Bought by
Rios Ignacios and Rios Guadalupe
Current Estimated Value
Home Financials for this Owner
Home Financials are based on the most recent Mortgage that was taken out on this home.
Original Mortgage
$337,500
Outstanding Balance
$174,355
Interest Rate
5.5%
Mortgage Type
Purchase Money Mortgage
Estimated Equity
$434,348
Purchase Details
Closed on
Sep 3, 2003
Sold by
Mclaughlin Evan and Mclaughlin Eveline
Bought by
Rios Ignacios and Rios Guadalupe
Home Financials for this Owner
Home Financials are based on the most recent Mortgage that was taken out on this home.
Original Mortgage
$239,900
Interest Rate
5.87%
Mortgage Type
Purchase Money Mortgage
Create a Home Valuation Report for This Property
The Home Valuation Report is an in-depth analysis detailing your home's value as well as a comparison with similar homes in the area
Home Values in the Area
Average Home Value in this Area
Purchase History
| Date | Buyer | Sale Price | Title Company |
|---|---|---|---|
| Rios Ignacios | -- | Fidelity National Title Co | |
| Rios Guadalupe | -- | Fidelity National Title Co | |
| Rios Ignacios | $300,000 | Chicago Title Co |
Source: Public Records
Mortgage History
| Date | Status | Borrower | Loan Amount |
|---|---|---|---|
| Open | Rios Guadalupe | $337,500 | |
| Previous Owner | Rios Ignacios | $239,900 |
Source: Public Records
Tax History
| Year | Tax Paid | Tax Assessment Tax Assessment Total Assessment is a certain percentage of the fair market value that is determined by local assessors to be the total taxable value of land and additions on the property. | Land | Improvement |
|---|---|---|---|---|
| 2025 | $4,647 | $426,378 | $184,825 | $241,553 |
| 2023 | $4,647 | $409,823 | $177,649 | $232,174 |
| 2022 | $4,567 | $401,788 | $174,166 | $227,622 |
| 2021 | $4,619 | $393,910 | $170,751 | $223,159 |
| 2020 | $4,119 | $351,000 | $153,000 | $198,000 |
| 2019 | $4,050 | $344,000 | $150,000 | $194,000 |
| 2018 | $3,879 | $328,000 | $143,000 | $185,000 |
| 2017 | $3,697 | $312,000 | $136,000 | $176,000 |
| 2016 | $3,373 | $284,000 | $124,000 | $160,000 |
| 2014 | $2,954 | $245,000 | $107,000 | $138,000 |
Source: Public Records
Map
Nearby Homes
- 240 Quail Cir
- 321 N Third St
- 505 N 1st St
- 109 S 3rd St
- 1204 E Walnut Ave Unit B
- 801, 851 California 246
- 622 N B St
- 1200 Peach Ave
- 205 S E St
- 319 S B St
- 1416 E Walnut Ave
- 610 E Pine Ave Unit 10
- 610 E Pine Ave Unit 29
- 610 E Pine Ave Unit 62
- 533 N G St
- 1105 E Olive Ave
- 510 N I St
- 117 S I St
- 209 S 7th St
- 601 N Seventh St
Your Personal Tour Guide
Ask me questions while you tour the home.