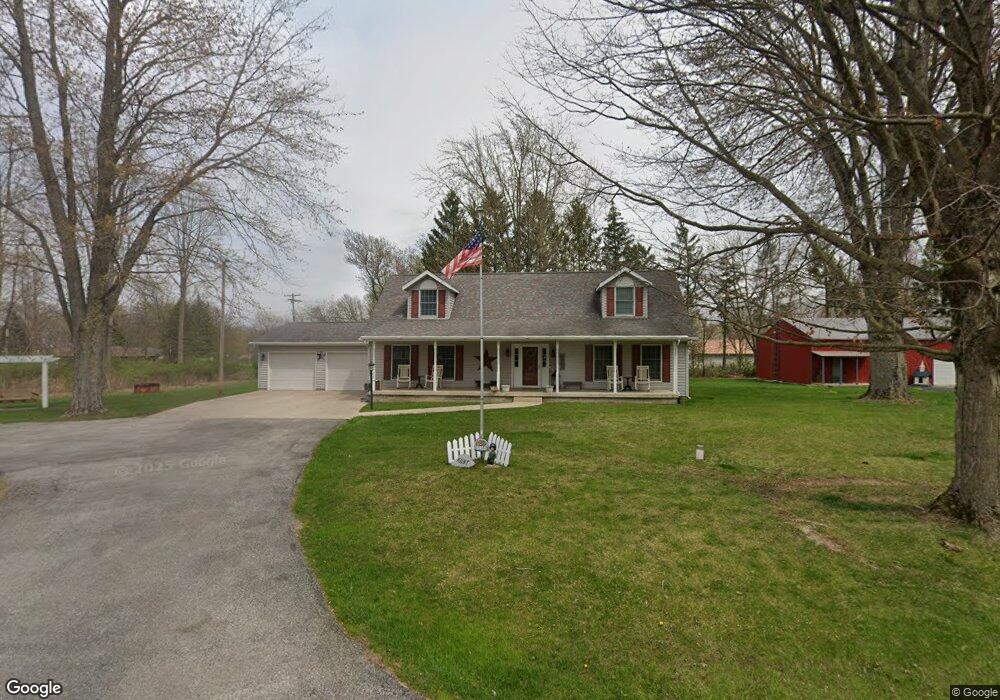
235 N Delaware Blvd La Fontaine, IN 46940
Estimated Value: $234,000 - $351,000
3
Beds
3
Baths
1,962
Sq Ft
$152/Sq Ft
Est. Value
About This Home
This home is located at 235 N Delaware Blvd, La Fontaine, IN 46940 and is currently estimated at $298,339, approximately $152 per square foot. 235 N Delaware Blvd is a home located in Wabash County.
Ownership History
Date
Name
Owned For
Owner Type
Purchase Details
Closed on
Nov 5, 2009
Sold by
Voke Randy L and Voke Linda
Bought by
Hunt Charles L and Hunt Diana L
Current Estimated Value
Home Financials for this Owner
Home Financials are based on the most recent Mortgage that was taken out on this home.
Original Mortgage
$130,000
Outstanding Balance
$84,673
Interest Rate
5.11%
Mortgage Type
VA
Estimated Equity
$213,666
Purchase Details
Closed on
Oct 28, 2009
Sold by
Voke Randy L and Voke Linda
Bought by
Hunt Charles L and Hunt Diana L
Home Financials for this Owner
Home Financials are based on the most recent Mortgage that was taken out on this home.
Original Mortgage
$130,000
Outstanding Balance
$84,673
Interest Rate
5.11%
Mortgage Type
VA
Estimated Equity
$213,666
Create a Home Valuation Report for This Property
The Home Valuation Report is an in-depth analysis detailing your home's value as well as a comparison with similar homes in the area
Home Values in the Area
Average Home Value in this Area
Purchase History
| Date | Buyer | Sale Price | Title Company |
|---|---|---|---|
| Hunt Charles L | -- | -- | |
| Hunt Charles L | -- | None Available |
Source: Public Records
Mortgage History
| Date | Status | Borrower | Loan Amount |
|---|---|---|---|
| Open | Hunt Charles L | $130,000 |
Source: Public Records
Tax History Compared to Growth
Tax History
| Year | Tax Paid | Tax Assessment Tax Assessment Total Assessment is a certain percentage of the fair market value that is determined by local assessors to be the total taxable value of land and additions on the property. | Land | Improvement |
|---|---|---|---|---|
| 2024 | $1,101 | $229,200 | $47,600 | $181,600 |
| 2023 | $1,199 | $233,600 | $47,600 | $186,000 |
| 2022 | $868 | $211,200 | $38,100 | $173,100 |
| 2021 | $777 | $185,300 | $38,100 | $147,200 |
| 2020 | $830 | $189,300 | $38,100 | $151,200 |
| 2019 | $483 | $156,900 | $38,100 | $118,800 |
| 2018 | $537 | $156,400 | $38,100 | $118,300 |
| 2017 | $494 | $150,800 | $38,100 | $112,700 |
| 2016 | $394 | $149,100 | $38,100 | $111,000 |
| 2014 | $340 | $154,200 | $38,100 | $116,100 |
| 2013 | $325 | $154,100 | $38,100 | $116,000 |
Source: Public Records
Map
Nearby Homes
- 82 N Delaware Ln
- 79 Delaware Ln
- 78 N Delaware Ln
- 85 E Miller Rd
- 135 N Delaware Blvd
- 108 N Delaware Ln
- 110 N Delaware Ln
- 85 N Delaware Ln
- 75 N Delaware Ln
- 112 Elm St
- 249 N Mississinewa Ct
- 120 N Delaware Blvd
- 120 N Delaware Ln
- 87 N Delaware Ln
- 74 N Delaware Ln
- 115 Waucoon Dr
- 105 Bundy Ct
- 67 N Delaware Ln
- 101 Bundy Ct
- 285 N Delaware Blvd