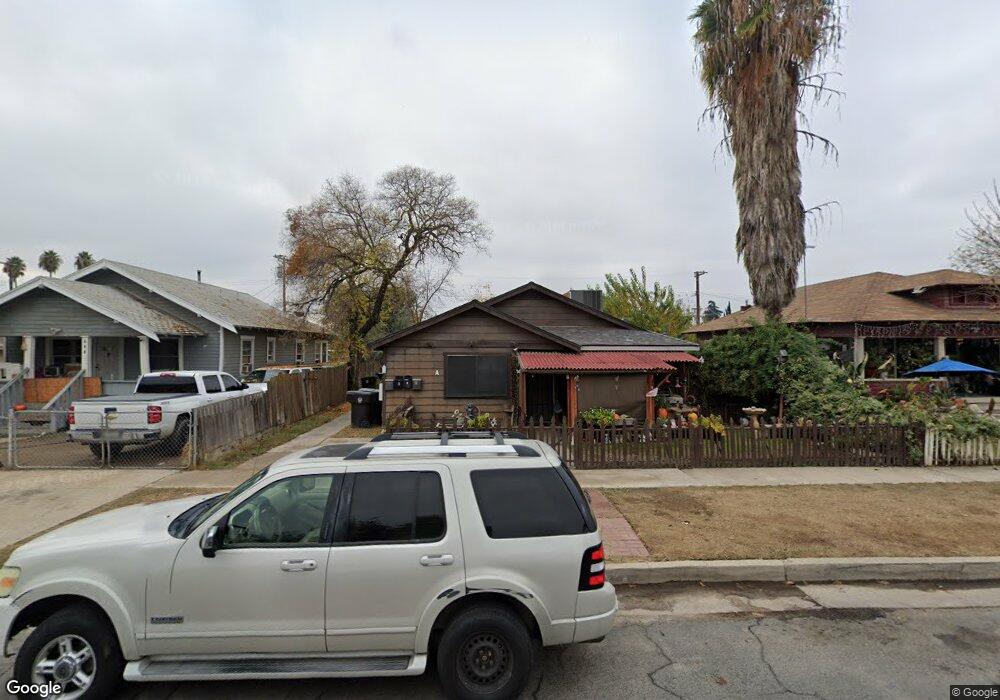
235 N H St Tulare, CA 93274
Estimated Value: $459,000 - $515,000
2
Beds
1
Bath
750
Sq Ft
$642/Sq Ft
Est. Value
About This Home
This home is located at 235 N H St, Tulare, CA 93274 and is currently estimated at $481,785, approximately $642 per square foot. 235 N H St is a home located in Tulare County with nearby schools including Maple Elementary School, Los Tules Middle School, and Tulare Western High School.
Ownership History
Date
Name
Owned For
Owner Type
Purchase Details
Closed on
Nov 3, 2022
Sold by
Cofre Rosie and Cofre Carlos
Bought by
Cofre 2022 Living Trust
Current Estimated Value
Purchase Details
Closed on
Sep 26, 2022
Sold by
Cofre Rosie and Cofre Carlos
Bought by
Cofre 2022 Living Trust and Cofre
Purchase Details
Closed on
Sep 23, 2002
Sold by
Sousa Jorge M
Bought by
Cofre Carlos and Cofre Rosie
Home Financials for this Owner
Home Financials are based on the most recent Mortgage that was taken out on this home.
Original Mortgage
$111,750
Interest Rate
6.28%
Mortgage Type
Purchase Money Mortgage
Purchase Details
Closed on
Oct 20, 2000
Sold by
Wells Fargo Home Mtg Inc
Bought by
Hud
Purchase Details
Closed on
Apr 24, 1996
Sold by
Sousa Jorge M
Bought by
Sousa Jorge M and Sousa Maria N
Home Financials for this Owner
Home Financials are based on the most recent Mortgage that was taken out on this home.
Original Mortgage
$106,500
Interest Rate
4.75%
Mortgage Type
Purchase Money Mortgage
Create a Home Valuation Report for This Property
The Home Valuation Report is an in-depth analysis detailing your home's value as well as a comparison with similar homes in the area
Home Values in the Area
Average Home Value in this Area
Purchase History
| Date | Buyer | Sale Price | Title Company |
|---|---|---|---|
| Cofre 2022 Living Trust | -- | -- | |
| Cofre 2022 Living Trust | -- | None Listed On Document | |
| Cofre Carlos | $150,000 | First American Title Co | |
| Hud | -- | First American Title Ins Co | |
| Sousa Jorge M | -- | Old Republic Title Company |
Source: Public Records
Mortgage History
| Date | Status | Borrower | Loan Amount |
|---|---|---|---|
| Previous Owner | Cofre Carlos | $111,750 | |
| Previous Owner | Sousa Jorge M | $106,500 |
Source: Public Records
Tax History
| Year | Tax Paid | Tax Assessment Tax Assessment Total Assessment is a certain percentage of the fair market value that is determined by local assessors to be the total taxable value of land and additions on the property. | Land | Improvement |
|---|---|---|---|---|
| 2025 | $2,365 | $217,253 | $46,346 | $170,907 |
| 2024 | $2,365 | $212,994 | $45,438 | $167,556 |
| 2023 | $2,304 | $208,819 | $44,548 | $164,271 |
| 2022 | $2,237 | $204,725 | $43,675 | $161,050 |
| 2021 | $2,209 | $200,711 | $42,819 | $157,892 |
| 2020 | $2,246 | $198,653 | $42,380 | $156,273 |
| 2019 | $2,302 | $194,758 | $41,549 | $153,209 |
| 2018 | $2,265 | $190,939 | $40,734 | $150,205 |
| 2017 | $2,244 | $187,195 | $39,935 | $147,260 |
| 2016 | $2,146 | $183,525 | $39,152 | $144,373 |
| 2015 | $2,074 | $180,768 | $38,564 | $142,204 |
| 2014 | $2,074 | $177,227 | $37,809 | $139,418 |
Source: Public Records
Map
Nearby Homes
- 348 N F St
- 0 0 Unit CV26015491
- 560 N F St
- 129 S C St
- 110 W Owens Ave
- 202 N L St
- 947 W Kern Ave
- 1112 W San Joaquin Ave
- 260 N Los Angeles St
- 620 Mariposa Ave
- 563 N O St
- 605 Catalina Cir
- 560 W Pleasant Ave Unit 16
- 560 W Pleasant Ave Unit 75
- 560 W Pleasant Ave Unit 26
- 908 N Beatrice Dr
- 615 Catalina Cir
- 429 S Sacramento St
- 815 E Sycamore Ave
- 1969 Oak Falls Ct
Your Personal Tour Guide
Ask me questions while you tour the home.